|
Download Data (XLS File) |
|
||||||||
|
||||||||
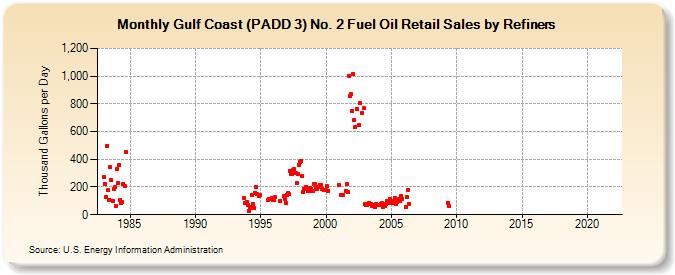
| Gulf Coast (PADD 3) No. 2 Fuel Oil Retail Sales by Refiners (Thousand Gallons per Day) | ||||||||
| Year | Jan | Feb | Mar | Apr | May | Jun | Jul | Aug | Sep | Oct | Nov | Dec |
|---|---|---|---|---|---|---|---|---|---|---|---|---|
| 1983 | 268.9 | 224.6 | 128.3 | 493.0 | 175.9 | 107.5 | 344.2 | 250.5 | 101.2 | 188.7 | 198.6 | 63.7 |
| 1984 | 327.1 | 232.0 | 356.2 | 102.6 | 84.4 | 93.7 | 224.8 | 206.6 | 455.6 | |||
| 1993 | 123.0 | 81.7 | 93.3 | |||||||||
| 1994 | 66.6 | 26.5 | 49.4 | 52.1 | 139.8 | 80.3 | 48.2 | 159.9 | 199.3 | 146.8 | 134.5 | 139.9 |
| 1995 | W | W | W | W | W | W | W | 102.7 | 115.4 | W | 117.0 | 109.5 |
| 1996 | 105.9 | 125.9 | W | W | W | W | 102.1 | W | W | 132.6 | 113.7 | 84.2 |
| 1997 | 145.0 | 153.3 | 147.0 | 313.9 | 295.2 | 293.9 | 325.3 | 327.2 | 302.4 | 227.1 | 292.6 | 357.7 |
| 1998 | 382.9 | 389.4 | 278.2 | 163.8 | 184.4 | 183.4 | 202.3 | 170.9 | 174.6 | 190.9 | 186.2 | 170.2 |
| 1999 | 172.5 | 223.9 | 218.0 | 197.4 | 185.6 | 203.3 | 213.8 | 214.6 | 183.3 | W | 175.6 | W |
| 2000 | 178.6 | 205.2 | 174.0 | W | W | W | W | W | W | W | W | W |
| 2001 | 211.6 | W | 143.5 | W | 141.7 | W | 172.7 | 221.4 | 161.1 | 999.5 | 858.3 | 868.8 |
| 2002 | 750.5 | 1,016.2 | 681.6 | 633.6 | 761.1 | W | 648.9 | 805.7 | NA | 736.3 | W | 766.8 |
| 2003 | 80.4 | 72.7 | 67.9 | 82.5 | 74.1 | 75.8 | 63.1 | 66.3 | 68.6 | 55.1 | 74.4 | 70.6 |
| 2004 | 70.7 | 69.8 | 74.5 | 82.3 | 58.1 | 65.7 | 65.8 | 77.4 | 101.9 | 100.2 | 84.6 | 110.3 |
| 2005 | 89.7 | 83.6 | 100.5 | 121.6 | 77.6 | 90.7 | 100.5 | 109.8 | 99.5 | 132.5 | 116.1 | W |
| 2006 | W | 57.6 | 127.4 | 180.4 | 78.4 | W | W | W | W | W | W | W |
| 2007 | W | W | W | W | W | W | W | W | - | - | W | W |
| 2008 | W | W | W | W | W | W | W | W | W | W | W | W |
| 2009 | W | W | W | W | 87.7 | 60.3 | W | W | W | W | W | W |
| 2010 | W | W | W | W | - | - | - | - | - | - | - | - |
| 2011 | - | - | - | - | - | W | - | - | - | - | - | - |
| 2012 | - | - | - | - | - | - | - | - | - | - | - | - |
| 2013 | - | - | - | - | - | - | - | - | - | - | - | - |
| 2014 | - | - | - | - | - | - | - | - | - | - | - | - |
| 2015 | - | - | - | - | - | - | - | - | - | - | - | - |
| 2016 | - | - | - | - | - | - | - | - | - | - | - | - |
| 2017 | - | - | - | - | - | - | - | - | - | - | - | - |
| 2018 | - | - | - | - | - | - | - | - | - | - | - | - |
| 2019 | - | - | - | - | - | - | - | - | - | - | - | - |
| 2020 | - | - | - | - | - | - | - | - | - | - | - | - |
| 2021 | - | - | - | - | - | - | - | - | - | - | - | - |
| 2022 | - | - | - | |||||||||
| - = No Data Reported; -- = Not Applicable; NA = Not Available; W = Withheld to avoid disclosure of individual company data. |
| Release Date: 6/1/2022 |
| Next Release Date: TBD |