|
Download Data (XLS File) |
|
||||||||
|
||||||||
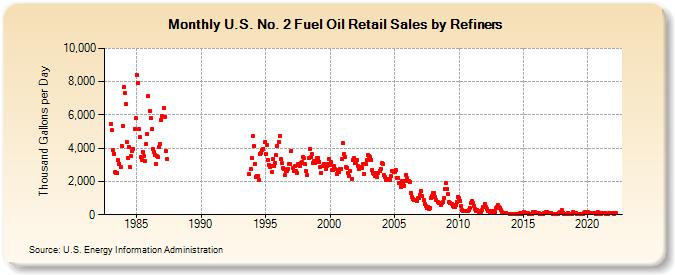
| U.S. No. 2 Fuel Oil Retail Sales by Refiners (Thousand Gallons per Day) | ||||||||
| Year | Jan | Feb | Mar | Apr | May | Jun | Jul | Aug | Sep | Oct | Nov | Dec |
|---|---|---|---|---|---|---|---|---|---|---|---|---|
| 1983 | 5,468.9 | 5,087.6 | 3,884.8 | 3,666.3 | 2,568.3 | 2,516.9 | 2,533.5 | 3,279.5 | 3,077.6 | 2,864.8 | 4,155.2 | 5,306.1 |
| 1984 | 7,673.8 | 7,329.6 | 6,654.8 | 4,381.5 | 3,425.8 | 4,066.9 | 2,841.6 | 3,505.5 | 3,801.5 | 3,967.3 | 5,155.1 | 5,791.0 |
| 1985 | 8,422.2 | 7,920.5 | 5,128.7 | 4,692.4 | 3,441.8 | 3,266.6 | 3,756.4 | 3,514.6 | 3,224.7 | 4,263.3 | 4,859.2 | 7,108.8 |
| 1986 | 6,239.3 | 5,803.8 | 5,132.6 | 3,972.5 | 3,797.8 | 3,605.0 | 3,073.6 | 3,506.6 | 3,443.5 | 4,084.1 | 4,231.9 | 5,686.1 |
| 1987 | 5,924.6 | 6,418.3 | 5,896.0 | 3,846.5 | 3,351.7 | |||||||
| 1993 | 2,432.5 | 2,756.1 | 3,428.3 | |||||||||
| 1994 | 4,712.8 | 4,101.3 | 3,065.7 | 2,271.6 | 2,331.0 | 2,324.5 | 2,074.5 | 3,651.7 | 3,683.3 | 3,862.5 | 3,970.8 | 4,348.9 |
| 1995 | 3,648.5 | 4,201.3 | 3,308.3 | 2,995.6 | 2,874.1 | 2,902.5 | 2,562.0 | 3,342.2 | 2,902.8 | 3,137.2 | 3,589.8 | 4,137.9 |
| 1996 | 4,363.7 | 4,719.9 | 3,326.3 | 3,101.0 | 2,787.1 | 2,721.3 | 2,387.3 | 2,634.2 | 2,628.2 | 2,739.6 | 3,071.6 | 3,045.7 |
| 1997 | 3,846.4 | 2,788.2 | 2,634.5 | 2,910.5 | 2,650.3 | 2,533.3 | 3,024.4 | 2,997.2 | 2,932.4 | 3,119.2 | 3,140.5 | 3,464.0 |
| 1998 | 3,383.0 | 3,028.3 | 2,606.3 | 2,372.5 | 3,393.5 | 3,959.0 | 3,446.0 | 3,629.8 | 3,121.9 | 3,218.3 | 3,119.8 | 3,189.0 |
| 1999 | 3,413.2 | 3,433.9 | 3,199.3 | 2,872.0 | 2,534.6 | 2,913.1 | 3,029.7 | 3,051.7 | 2,763.0 | 2,929.2 | 3,033.5 | 3,373.4 |
| 2000 | 2,979.7 | 3,163.1 | 2,665.5 | 2,669.0 | 2,919.8 | 2,730.1 | 2,442.8 | 2,675.0 | 2,575.0 | 2,759.6 | 2,756.8 | 3,379.5 |
| 2001 | 4,289.1 | 3,643.3 | 3,477.8 | 2,889.9 | 2,813.7 | 2,498.8 | 2,338.2 | 2,635.2 | 2,145.6 | 3,281.7 | 3,386.5 | 3,112.0 |
| 2002 | 3,178.7 | 3,279.4 | 2,923.1 | 2,765.7 | 2,796.6 | 2,839.4 | 2,833.8 | 3,073.5 | 2,462.1 | 3,023.5 | 3,274.8 | 3,607.0 |
| 2003 | 3,556.6 | 3,458.5 | 3,294.5 | 2,667.4 | 2,496.3 | 2,422.9 | 2,343.4 | 2,494.8 | 2,241.7 | 2,530.3 | 2,628.7 | 2,759.9 |
| 2004 | 3,103.6 | 3,062.0 | 2,387.3 | 2,250.6 | 2,094.0 | 2,162.2 | 2,072.5 | 2,177.2 | 2,089.3 | 2,300.7 | 2,632.0 | 2,544.1 |
| 2005 | 2,590.3 | 2,708.8 | 2,199.9 | 2,193.4 | 1,899.3 | 1,892.9 | 1,673.9 | 2,019.8 | 1,882.6 | 1,734.8 | 2,030.9 | 2,397.1 |
| 2006 | 2,188.5 | 2,046.3 | 1,937.4 | 1,328.2 | 1,076.8 | 946.8 | 868.6 | 861.5 | 868.8 | 804.0 | 984.7 | 1,021.7 |
| 2007 | 1,165.5 | 1,419.1 | 1,108.0 | 860.2 | 674.1 | 533.7 | 401.0 | 479.7 | 355.2 | 406.7 | 1,004.2 | 1,119.1 |
| 2008 | 1,282.6 | 1,303.1 | 1,039.0 | 881.7 | 767.4 | 705.7 | 675.4 | 584.6 | 713.5 | 788.3 | 1,006.2 | 1,553.1 |
| 2009 | 1,883.5 | 1,533.7 | 1,221.0 | 758.5 | 691.2 | 622.9 | 494.5 | 463.8 | 479.7 | 554.9 | 787.7 | 1,091.0 |
| 2010 | 999.9 | 848.1 | 521.0 | 310.0 | 247.0 | 221.1 | 244.8 | 213.2 | 213.6 | 264.5 | 428.6 | 720.0 |
| 2011 | 796.0 | 689.2 | 533.0 | 352.4 | 204.9 | 286.1 | 220.1 | 156.0 | 154.7 | 272.2 | 439.2 | 473.3 |
| 2012 | 659.4 | 492.6 | 368.2 | 233.9 | 211.1 | 178.5 | 209.4 | 191.6 | 207.4 | 177.3 | 385.3 | 467.3 |
| 2013 | 573.9 | 464.1 | 406.6 | 256.7 | 157.9 | 117.2 | 110.4 | 99.1 | 117.3 | NA | NA | 63.5 |
| 2014 | 61.9 | 55.8 | 45.4 | 35.2 | 38.5 | 41.2 | 20.3 | 29.0 | 53.1 | 114.4 | 114.3 | 72.5 |
| 2015 | 147.4 | 114.4 | 127.8 | 89.1 | 77.0 | 47.1 | 36.7 | 61.5 | 55.4 | 171.8 | 147.2 | 141.1 |
| 2016 | 127.2 | 122.0 | 74.8 | 56.6 | 52.1 | 58.9 | 45.8 | 110.9 | 73.7 | 136.8 | 163.1 | 106.8 |
| 2017 | NA | 107.1 | 125.5 | 51.6 | NA | 46.1 | 64.5 | 51.0 | 53.3 | 107.5 | 151.7 | 108.5 |
| 2018 | 266.3 | 123.5 | 54.3 | 48.1 | 57.3 | 78.6 | 72.6 | 49.5 | 43.3 | 60.5 | 160.5 | 106.8 |
| 2019 | 114.3 | 78.0 | 63.5 | 50.2 | 51.4 | 65.8 | 48.8 | 59.6 | 80.7 | 150.6 | 103.0 | 115.9 |
| 2020 | 156.4 | 128.2 | 94.1 | 87.1 | 81.6 | 106.4 | 115.5 | 68.9 | 55.5 | 146.7 | 97.6 | 84.6 |
| 2021 | 68.1 | 89.8 | 86.8 | 84.0 | 74.5 | 51.4 | 46.5 | 62.8 | 99.2 | 95.4 | 96.4 | 89.9 |
| 2022 | 60.3 | 73.3 | 87.0 | |||||||||
| - = No Data Reported; -- = Not Applicable; NA = Not Available; W = Withheld to avoid disclosure of individual company data. |
| Release Date: 6/1/2022 |
| Next Release Date: TBD |