|
Download Data (XLS File) |
|
||||||||
|
||||||||
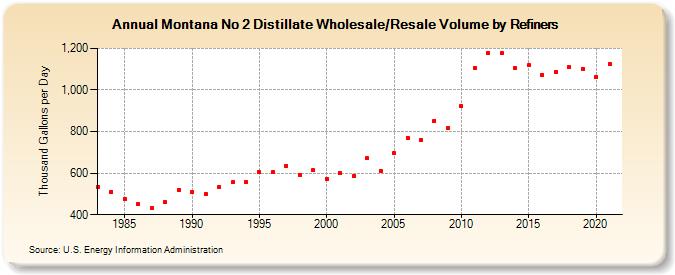
| Montana No 2 Distillate Wholesale/Resale Volume by Refiners (Thousand Gallons per Day) | ||||||||
| Decade | Year-0 | Year-1 | Year-2 | Year-3 | Year-4 | Year-5 | Year-6 | Year-7 | Year-8 | Year-9 |
|---|---|---|---|---|---|---|---|---|---|---|
| 1980's | 535.2 | 510.8 | 476.4 | 450.9 | 430.1 | 459.7 | 520.6 | |||
| 1990's | 507.8 | 499.7 | 534.8 | 555.5 | 557.1 | 605.0 | 603.9 | 635.8 | 593.3 | 613.5 |
| 2000's | 573.3 | 599.9 | 588.1 | 670.8 | 611.5 | 695.5 | 770.2 | 759.9 | 852.1 | 815.9 |
| 2010's | 922.2 | 1,106.6 | 1,179.4 | 1,176.3 | 1,106.8 | 1,118.2 | 1,073.6 | 1,087.9 | 1,110.3 | 1,101.5 |
| 2020's | 1,062.5 |
| - = No Data Reported; -- = Not Applicable; NA = Not Available; W = Withheld to avoid disclosure of individual company data. |
| Release Date: 6/1/2022 |
| Next Release Date: TBD |