|
Download Data (XLS File) |
|
||||||||
|
||||||||
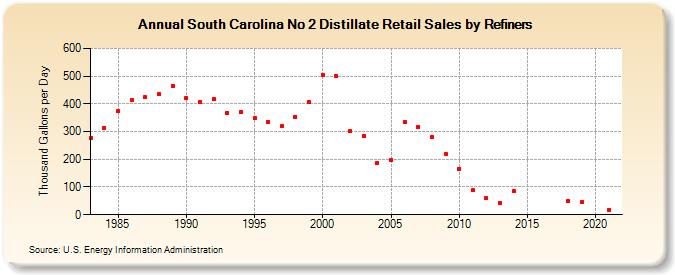
| South Carolina No 2 Distillate Retail Sales by Refiners (Thousand Gallons per Day) | ||||||||
| Decade | Year-0 | Year-1 | Year-2 | Year-3 | Year-4 | Year-5 | Year-6 | Year-7 | Year-8 | Year-9 |
|---|---|---|---|---|---|---|---|---|---|---|
| 1980's | 276.6 | 314.4 | 372.7 | 412.2 | 423.4 | 434.5 | 465.7 | |||
| 1990's | 419.5 | 407.1 | 418.2 | 368.1 | 371.4 | 348.3 | 335.8 | 318.4 | 353.3 | 405.1 |
| 2000's | 505.8 | 500.1 | 301.7 | 284.0 | 187.7 | 198.6 | 334.9 | 317.6 | 279.5 | 217.9 |
| 2010's | 165.3 | 88.9 | 59.9 | 43.3 | 84.0 | W | W | W | 48.1 | 47.2 |
| 2020's | W |
| - = No Data Reported; -- = Not Applicable; NA = Not Available; W = Withheld to avoid disclosure of individual company data. |
| Release Date: 6/1/2022 |
| Next Release Date: TBD |