|
Download Data (XLS File) |
|
||||||||
|
||||||||
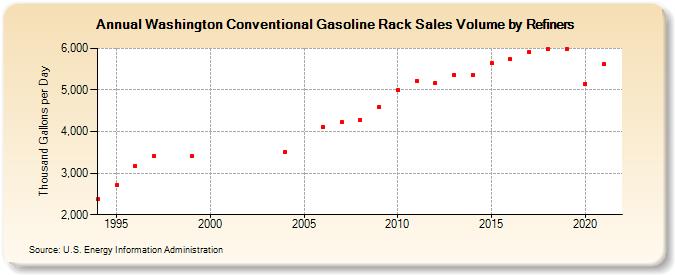
| Washington Conventional Gasoline Rack Sales Volume by Refiners (Thousand Gallons per Day) | ||||||||
| Decade | Year-0 | Year-1 | Year-2 | Year-3 | Year-4 | Year-5 | Year-6 | Year-7 | Year-8 | Year-9 |
|---|---|---|---|---|---|---|---|---|---|---|
| 1990's | 2,371.6 | 2,706.3 | 3,176.5 | 3,405.6 | W | 3,403.2 | ||||
| 2000's | W | W | W | W | 3,515.3 | W | 4,104.4 | 4,223.2 | 4,286.6 | 4,591.2 |
| 2010's | 4,996.8 | 5,226.8 | 5,175.7 | 5,360.2 | 5,368.6 | 5,640.7 | 5,739.6 | 5,918.2 | 5,977.2 | 5,987.6 |
| 2020's | 5,152.9 |
| - = No Data Reported; -- = Not Applicable; NA = Not Available; W = Withheld to avoid disclosure of individual company data. |
| Release Date: 6/1/2022 |
| Next Release Date: TBD |