|
Download Data (XLS File) |
|
||||||||
|
||||||||
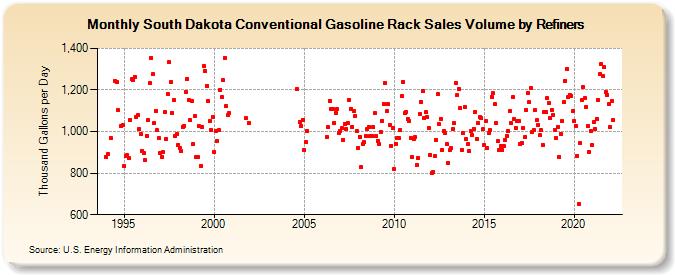
| South Dakota Conventional Gasoline Rack Sales Volume by Refiners (Thousand Gallons per Day) | ||||||||
| Year | Jan | Feb | Mar | Apr | May | Jun | Jul | Aug | Sep | Oct | Nov | Dec |
|---|---|---|---|---|---|---|---|---|---|---|---|---|
| 1994 | 879.0 | 891.3 | W | 968.9 | W | W | 1,243.4 | 1,238.9 | 1,101.3 | W | 1,025.4 | 1,030.5 |
| 1995 | 834.6 | 883.2 | 885.7 | 871.6 | 1,057.2 | 1,252.2 | 1,247.4 | 1,262.7 | 1,071.0 | 1,077.3 | 1,011.2 | 986.3 |
| 1996 | 908.4 | 896.1 | 863.0 | 979.4 | 1,054.1 | 1,232.8 | 1,356.0 | 1,275.4 | 1,039.9 | 1,100.7 | 1,005.3 | 967.5 |
| 1997 | 895.5 | 877.6 | 901.2 | 1,092.5 | 965.6 | 1,183.0 | 1,333.2 | 1,236.2 | 1,091.5 | 1,151.5 | 980.6 | 989.4 |
| 1998 | 937.5 | 919.3 | 907.4 | 1,024.0 | 1,028.2 | 1,192.4 | 1,254.2 | 1,153.8 | 1,053.2 | 1,149.2 | 939.3 | 1,072.5 |
| 1999 | 877.0 | 876.7 | 1,027.5 | 834.7 | 1,023.2 | 1,312.9 | 1,293.2 | 1,220.5 | 1,145.3 | 1,050.4 | 1,007.6 | 1,070.5 |
| 2000 | 902.7 | 1,003.5 | 953.6 | 1,006.4 | 1,201.8 | 1,165.7 | 1,245.8 | 1,355.0 | 1,122.4 | 1,077.9 | 1,088.2 | W |
| 2001 | W | W | W | W | W | W | W | W | W | 1,063.8 | W | 1,041.3 |
| 2002 | W | W | W | W | W | W | W | W | W | W | W | W |
| 2003 | W | W | W | W | W | W | W | W | W | W | W | W |
| 2004 | W | W | W | W | W | W | W | 1,204.8 | W | 1,046.0 | 1,027.6 | 1,057.4 |
| 2005 | 912.9 | 947.4 | 1,003.2 | W | W | W | W | W | W | W | W | W |
| 2006 | W | W | W | 971.4 | 1,020.5 | 1,147.5 | 1,108.8 | 1,107.9 | 1,040.3 | 1,091.0 | 1,106.5 | 991.3 |
| 2007 | 1,001.9 | 1,017.5 | 961.3 | 1,037.8 | 1,013.2 | 1,042.8 | 1,152.3 | 1,109.0 | 1,024.2 | 1,098.3 | 1,075.0 | 1,003.8 |
| 2008 | 921.8 | 976.1 | 827.8 | 941.2 | 949.0 | 977.2 | 1,010.8 | 1,022.4 | 979.5 | 980.4 | 1,020.9 | 1,088.6 |
| 2009 | 978.2 | 956.7 | 938.0 | 999.9 | 1,052.9 | 1,131.8 | 1,233.8 | 1,097.2 | 1,130.4 | 1,033.8 | 932.1 | 1,017.9 |
| 2010 | 819.2 | 940.5 | 968.7 | 968.7 | 1,007.5 | 1,171.7 | 1,240.2 | 1,088.9 | 1,095.9 | 1,059.6 | 1,049.2 | 970.1 |
| 2011 | 877.0 | 963.2 | 972.9 | 840.0 | 872.5 | 1,083.3 | 1,142.8 | 1,195.3 | 1,067.4 | 1,091.9 | 1,068.6 | 1,016.4 |
| 2012 | 887.3 | 800.2 | 805.4 | 880.3 | 959.8 | 1,179.4 | 1,034.6 | 1,062.0 | 911.2 | 1,002.9 | 990.8 | 938.0 |
| 2013 | 848.2 | 909.5 | 919.3 | 1,011.2 | 1,039.4 | 1,233.8 | 1,174.3 | 1,206.1 | 1,114.4 | 912.0 | 994.1 | 1,117.6 |
| 2014 | 962.0 | 940.6 | 904.5 | 1,001.7 | 984.5 | 1,014.4 | 1,095.5 | 965.5 | 1,040.6 | 1,067.8 | 1,062.8 | 1,010.0 |
| 2015 | 934.4 | 1,048.7 | 919.5 | 993.3 | 1,006.0 | 1,166.5 | 1,184.0 | 1,130.2 | 1,039.5 | 952.4 | 909.1 | 930.0 |
| 2016 | 909.1 | 928.4 | 959.5 | 977.2 | 1,004.1 | 1,097.5 | 1,040.2 | 1,164.8 | 1,059.0 | 1,018.4 | 1,049.5 | 1,051.9 |
| 2017 | 938.1 | 943.8 | 1,017.4 | 971.6 | 1,104.6 | 1,186.2 | 1,140.5 | 1,210.2 | 996.5 | 1,005.8 | 1,102.1 | 1,053.2 |
| 2018 | 1,030.5 | 981.2 | 1,005.5 | 935.4 | 1,092.1 | 1,091.8 | 1,160.9 | 1,137.9 | 1,063.0 | 1,104.6 | 1,081.6 | 1,008.4 |
| 2019 | 968.2 | 1,023.4 | 878.0 | 990.4 | 1,050.9 | 1,140.6 | 1,244.4 | 1,299.8 | 1,164.4 | 1,176.2 | 1,168.8 | 1,097.5 |
| 2020 | 1,048.6 | 1,027.3 | 883.0 | 652.1 | 943.2 | 1,150.1 | 1,213.4 | 1,160.0 | 1,118.1 | 1,027.0 | 902.6 | 1,002.8 |
| 2021 | 934.9 | 1,045.3 | 1,011.7 | 1,060.8 | 1,153.6 | 1,276.8 | 1,323.1 | 1,268.3 | 1,308.3 | 1,190.5 | 1,177.1 | 1,131.5 |
| 2022 | 1,020.2 | 1,145.1 | 1,056.9 | |||||||||
| - = No Data Reported; -- = Not Applicable; NA = Not Available; W = Withheld to avoid disclosure of individual company data. |
| Release Date: 6/1/2022 |
| Next Release Date: TBD |