|
Download Data (XLS File) |
|
||||||||
|
||||||||
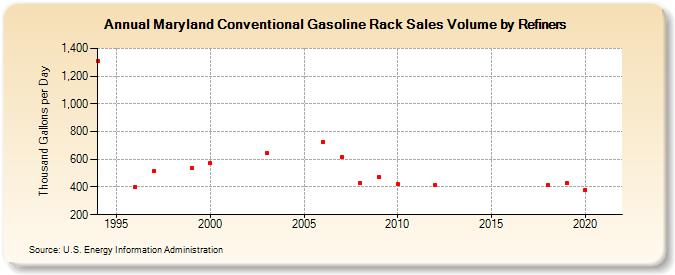
| Maryland Conventional Gasoline Rack Sales Volume by Refiners (Thousand Gallons per Day) | ||||||||
| Decade | Year-0 | Year-1 | Year-2 | Year-3 | Year-4 | Year-5 | Year-6 | Year-7 | Year-8 | Year-9 |
|---|---|---|---|---|---|---|---|---|---|---|
| 1990's | 1,308.8 | W | 402.1 | 516.7 | W | 536.6 | ||||
| 2000's | 570.7 | W | W | 645.8 | W | W | 723.6 | 615.7 | 425.6 | 471.0 |
| 2010's | 424.3 | W | 415.3 | W | W | W | W | W | 412.2 | 426.4 |
| 2020's | 379.0 |
| - = No Data Reported; -- = Not Applicable; NA = Not Available; W = Withheld to avoid disclosure of individual company data. |
| Release Date: 6/1/2022 |
| Next Release Date: TBD |