|
Download Data (XLS File) |
|
||||||||
|
||||||||
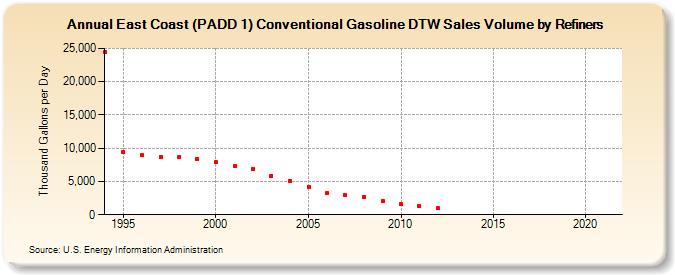
| East Coast (PADD 1) Conventional Gasoline DTW Sales Volume by Refiners (Thousand Gallons per Day) | ||||||||
| Decade | Year-0 | Year-1 | Year-2 | Year-3 | Year-4 | Year-5 | Year-6 | Year-7 | Year-8 | Year-9 |
|---|---|---|---|---|---|---|---|---|---|---|
| 1990's | 24,475.5 | 9,362.9 | 8,926.6 | 8,684.6 | 8,601.2 | 8,417.2 | ||||
| 2000's | 7,893.9 | 7,276.3 | 6,843.8 | 5,857.7 | 5,067.0 | 4,232.2 | 3,292.5 | 2,903.4 | 2,718.0 | 2,026.9 |
| 2010's | 1,556.5 | 1,253.5 | 964.3 | W | W | W | W | W | W | W |
| 2020's | W |
| - = No Data Reported; -- = Not Applicable; NA = Not Available; W = Withheld to avoid disclosure of individual company data. |
| Release Date: 6/1/2022 |
| Next Release Date: TBD |