|
Download Data (XLS File) |
|
||||||||
|
||||||||
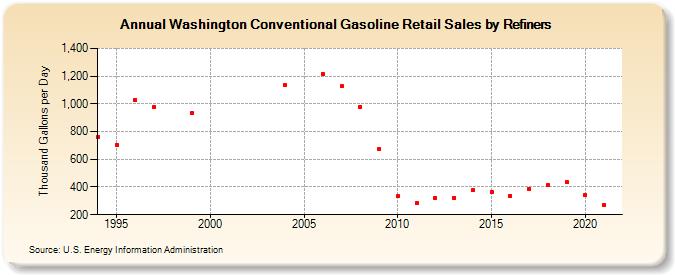
| Washington Conventional Gasoline Retail Sales by Refiners (Thousand Gallons per Day) | ||||||||
| Decade | Year-0 | Year-1 | Year-2 | Year-3 | Year-4 | Year-5 | Year-6 | Year-7 | Year-8 | Year-9 |
|---|---|---|---|---|---|---|---|---|---|---|
| 1990's | 761.5 | 706.3 | 1,028.3 | 978.7 | W | 932.8 | ||||
| 2000's | W | W | W | W | 1,133.9 | W | 1,215.4 | 1,125.8 | 977.8 | 673.6 |
| 2010's | 334.3 | 282.5 | 319.3 | 322.9 | 376.5 | 366.0 | 336.9 | 388.5 | 410.9 | 435.8 |
| 2020's | 340.3 |
| - = No Data Reported; -- = Not Applicable; NA = Not Available; W = Withheld to avoid disclosure of individual company data. |
| Release Date: 6/1/2022 |
| Next Release Date: TBD |