|
Download Data (XLS File) |
|
||||||||
|
||||||||
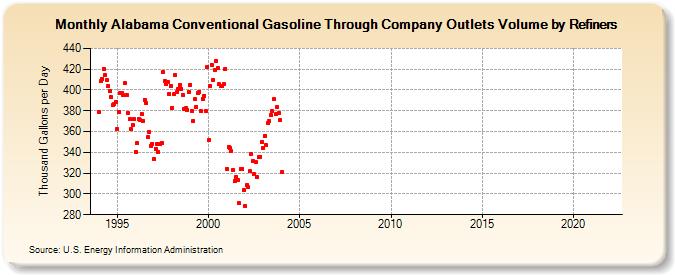
| Alabama Conventional Gasoline Through Company Outlets Volume by Refiners (Thousand Gallons per Day) | ||||||||
| Year | Jan | Feb | Mar | Apr | May | Jun | Jul | Aug | Sep | Oct | Nov | Dec |
|---|---|---|---|---|---|---|---|---|---|---|---|---|
| 1994 | 378.5 | 408.3 | 410.9 | 420.5 | 414.5 | 409.7 | 404.0 | 398.6 | 393.1 | 385.5 | 386.6 | 388.4 |
| 1995 | 362.4 | 379.0 | 397.5 | 397.2 | 395.3 | 406.6 | 395.1 | 377.5 | 371.6 | 362.4 | 366.1 | 372.3 |
| 1996 | 340.8 | 348.7 | 372.1 | 371.0 | 376.7 | 370.6 | 390.7 | 387.5 | 354.7 | 359.5 | 346.5 | 348.4 |
| 1997 | 334.0 | 343.6 | 347.8 | 340.1 | 347.7 | 349.0 | 416.9 | 408.2 | 405.5 | 407.5 | 396.2 | 404.0 |
| 1998 | 383.0 | 395.7 | 414.2 | 397.6 | 401.4 | 404.7 | 401.0 | 395.2 | 381.7 | 382.3 | 380.9 | 398.0 |
| 1999 | 404.9 | 380.0 | 370.2 | 390.9 | 383.7 | 396.9 | 398.2 | 379.4 | 391.7 | 394.3 | 379.6 | 422.2 |
| 2000 | 351.5 | 403.9 | 424.5 | 409.6 | 419.6 | 428.2 | 421.2 | 405.3 | 403.4 | 403.4 | 405.4 | 420.2 |
| 2001 | 324.4 | 345.0 | 344.2 | 341.1 | 323.4 | 312.4 | 316.5 | 313.8 | 290.9 | 324.3 | 324.2 | 303.4 |
| 2002 | 288.4 | 308.4 | 306.4 | 321.6 | 338.5 | 331.9 | 319.1 | 330.5 | 315.8 | 335.6 | 336.0 | 350.0 |
| 2003 | 344.5 | 356.1 | 346.7 | 367.9 | 369.7 | 375.5 | 379.6 | 391.1 | 376.6 | 383.6 | 377.8 | 371.0 |
| 2004 | 320.7 | W | W | W | W | W | W | W | W | W | W | W |
| 2005 | W | W | W | W | W | W | W | W | W | W | W | W |
| 2006 | W | W | W | W | W | W | W | W | W | W | W | W |
| 2007 | W | W | W | W | W | W | W | W | W | W | W | W |
| 2008 | W | W | W | W | W | W | W | W | W | W | W | W |
| 2009 | W | W | W | W | W | W | W | W | W | W | W | W |
| 2010 | W | W | W | W | W | W | W | W | W | W | W | W |
| 2011 | W | W | W | W | W | W | W | W | W | - | - | - |
| 2012 | - | - | - | - | - | - | - | - | - | - | - | - |
| 2013 | - | - | - | - | - | - | - | - | - | - | - | - |
| 2014 | - | - | W | W | W | W | W | W | W | W | W | W |
| 2015 | W | W | W | W | W | W | W | W | W | W | W | W |
| 2016 | W | W | W | W | W | W | W | W | W | W | W | W |
| 2017 | - | - | - | - | - | - | - | - | - | - | - | - |
| 2018 | - | - | - | - | - | - | - | - | - | - | - | - |
| 2019 | - | - | - | - | W | W | W | W | W | W | W | W |
| 2020 | W | W | W | W | W | W | W | W | W | W | W | W |
| 2021 | W | W | W | W | W | - | - | - | - | - | - | - |
| 2022 | - | - | - | |||||||||
| - = No Data Reported; -- = Not Applicable; NA = Not Available; W = Withheld to avoid disclosure of individual company data. |
| Release Date: 6/1/2022 |
| Next Release Date: TBD |