|
Download Data (XLS File) |
|
||||||||
|
||||||||
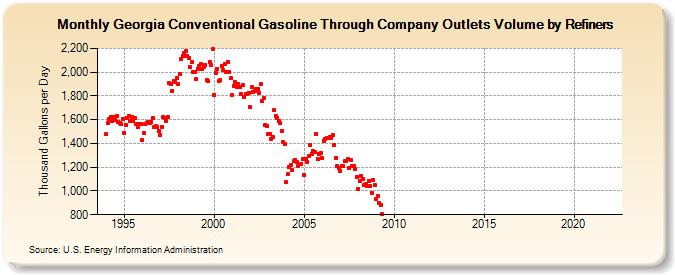
| Georgia Conventional Gasoline Through Company Outlets Volume by Refiners (Thousand Gallons per Day) | ||||||||
| Year | Jan | Feb | Mar | Apr | May | Jun | Jul | Aug | Sep | Oct | Nov | Dec |
|---|---|---|---|---|---|---|---|---|---|---|---|---|
| 1994 | 1,479.1 | 1,570.0 | 1,602.5 | 1,624.1 | 1,587.6 | 1,626.1 | 1,598.3 | 1,628.6 | 1,584.0 | 1,575.8 | 1,562.9 | 1,604.8 |
| 1995 | 1,490.8 | 1,556.8 | 1,617.7 | 1,631.3 | 1,586.7 | 1,626.3 | 1,589.2 | 1,610.0 | 1,563.5 | 1,536.7 | 1,559.4 | 1,562.9 |
| 1996 | 1,427.7 | 1,491.8 | 1,566.7 | 1,575.8 | 1,581.6 | 1,575.5 | 1,580.9 | 1,615.5 | 1,537.7 | 1,544.1 | 1,540.2 | 1,505.3 |
| 1997 | 1,472.5 | 1,539.1 | 1,620.4 | 1,610.0 | 1,592.1 | 1,624.5 | 1,905.5 | 1,899.5 | 1,844.9 | 1,923.2 | 1,916.8 | 1,951.6 |
| 1998 | 1,898.7 | 1,981.3 | 2,106.7 | 2,136.9 | 2,164.7 | 2,178.9 | 2,140.1 | 2,116.9 | 2,040.3 | 2,081.5 | 2,002.5 | 2,003.3 |
| 1999 | 1,943.4 | 2,027.4 | 2,052.7 | 2,071.4 | 2,030.2 | 2,043.1 | 2,059.7 | 1,932.0 | 1,922.0 | 2,081.7 | 2,062.2 | 2,193.0 |
| 2000 | 1,806.5 | 1,996.2 | 2,028.5 | 1,923.8 | 1,931.9 | 2,052.8 | 2,019.2 | 2,072.7 | 1,999.8 | 2,087.5 | 2,003.2 | 1,949.0 |
| 2001 | 1,806.7 | 1,885.9 | 1,918.6 | 1,872.2 | 1,898.2 | 1,872.2 | 1,818.3 | 1,891.4 | 1,794.6 | 1,818.1 | 1,815.8 | 1,828.5 |
| 2002 | 1,709.9 | 1,873.8 | 1,833.7 | 1,840.8 | 1,857.6 | 1,860.4 | 1,828.5 | 1,896.9 | 1,759.3 | 1,779.0 | 1,559.3 | 1,543.3 |
| 2003 | 1,479.6 | 1,480.8 | 1,441.3 | 1,456.9 | 1,683.5 | 1,634.5 | 1,617.2 | 1,585.6 | 1,574.0 | 1,508.1 | 1,414.4 | 1,396.2 |
| 2004 | 1,071.4 | 1,140.6 | 1,199.3 | 1,214.6 | 1,179.0 | 1,253.8 | 1,257.5 | 1,246.4 | 1,211.6 | 1,228.2 | 1,230.8 | 1,269.7 |
| 2005 | 1,130.7 | 1,265.6 | 1,243.0 | 1,292.9 | 1,384.2 | 1,314.0 | 1,336.9 | 1,331.5 | 1,482.0 | 1,268.0 | 1,310.1 | 1,318.5 |
| 2006 | 1,280.4 | 1,422.4 | 1,437.6 | 1,445.2 | 1,445.7 | 1,452.1 | 1,449.3 | 1,473.3 | 1,386.4 | 1,279.4 | 1,207.0 | 1,196.8 |
| 2007 | 1,169.3 | 1,209.3 | 1,207.2 | 1,248.4 | 1,249.4 | 1,266.6 | 1,195.5 | 1,261.3 | 1,213.8 | 1,211.0 | 1,182.5 | 1,114.1 |
| 2008 | 1,017.9 | 1,079.7 | 1,126.2 | 1,101.2 | 1,052.6 | 1,056.0 | 1,040.4 | 1,085.3 | 1,042.6 | 982.6 | 1,088.0 | 1,047.3 |
| 2009 | 934.7 | 953.9 | 899.5 | 878.2 | 803.2 | W | W | W | W | W | W | W |
| 2010 | W | W | W | W | W | W | W | W | W | W | W | W |
| 2011 | W | W | W | W | W | W | W | W | W | - | - | - |
| 2012 | - | - | - | - | - | - | - | - | - | - | - | - |
| 2013 | - | - | - | - | - | - | - | - | - | - | - | - |
| 2014 | - | - | W | W | W | W | W | W | W | W | W | W |
| 2015 | W | W | W | W | W | W | W | W | W | W | W | W |
| 2016 | W | W | W | W | W | W | W | W | W | W | W | W |
| 2017 | W | W | W | W | W | W | W | W | W | W | W | W |
| 2018 | W | W | W | W | W | W | W | W | W | W | W | W |
| 2019 | W | W | W | W | W | W | W | W | W | W | W | W |
| 2020 | W | W | W | W | W | W | W | W | W | W | W | W |
| 2021 | W | W | W | W | W | - | - | - | - | - | - | - |
| 2022 | - | - | - | |||||||||
| - = No Data Reported; -- = Not Applicable; NA = Not Available; W = Withheld to avoid disclosure of individual company data. |
| Release Date: 6/1/2022 |
| Next Release Date: TBD |