|
Download Data (XLS File) |
|
||||||||
|
||||||||
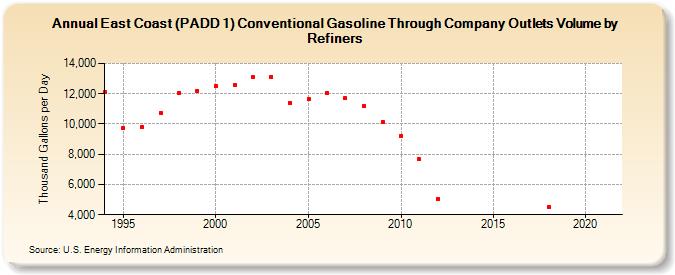
| East Coast (PADD 1) Conventional Gasoline Through Company Outlets Volume by Refiners (Thousand Gallons per Day) | ||||||||
| Decade | Year-0 | Year-1 | Year-2 | Year-3 | Year-4 | Year-5 | Year-6 | Year-7 | Year-8 | Year-9 |
|---|---|---|---|---|---|---|---|---|---|---|
| 1990's | 12,134.4 | 9,717.8 | 9,820.8 | 10,749.0 | 12,070.1 | 12,184.6 | ||||
| 2000's | 12,479.3 | 12,578.8 | 13,084.8 | 13,128.5 | 11,408.0 | 11,662.9 | 12,034.8 | 11,687.7 | 11,176.1 | 10,118.5 |
| 2010's | 9,227.0 | 7,660.7 | 5,067.8 | W | W | W | W | W | 4,514.0 | W |
| 2020's | W |
| - = No Data Reported; -- = Not Applicable; NA = Not Available; W = Withheld to avoid disclosure of individual company data. |
| Release Date: 6/1/2022 |
| Next Release Date: TBD |