|
Download Data (XLS File) |
|
||||||||
|
||||||||
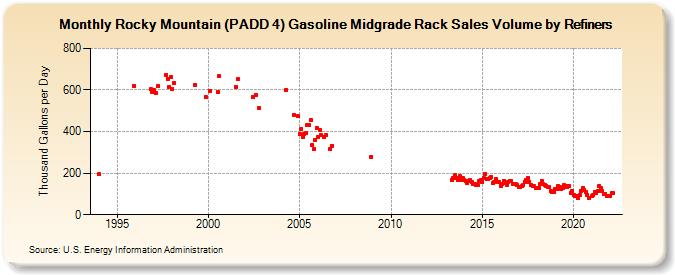
| Rocky Mountain (PADD 4) Gasoline Midgrade Rack Sales Volume by Refiners (Thousand Gallons per Day) | ||||||||
| Year | Jan | Feb | Mar | Apr | May | Jun | Jul | Aug | Sep | Oct | Nov | Dec |
|---|---|---|---|---|---|---|---|---|---|---|---|---|
| 1994 | 195.5 | W | W | W | W | W | W | W | W | W | W | W |
| 1995 | W | W | W | W | W | W | W | W | W | W | W | 619.8 |
| 1996 | W | W | W | W | W | W | W | W | W | W | 602.5 | 588.6 |
| 1997 | 600.5 | 587.8 | W | 620.2 | W | W | W | W | 672.3 | 654.3 | 615.2 | 661.4 |
| 1998 | 604.8 | 635.3 | W | W | W | W | W | W | W | W | W | W |
| 1999 | W | W | W | 626.2 | W | W | W | W | W | W | 566.6 | W |
| 2000 | W | 595.6 | W | W | W | W | 590.5 | 666.2 | W | W | W | W |
| 2001 | W | W | W | W | W | W | 614.3 | 651.4 | W | W | W | W |
| 2002 | W | W | W | W | W | 566.4 | W | 576.0 | W | 513.3 | W | W |
| 2003 | W | W | W | W | W | W | W | W | W | W | W | W |
| 2004 | W | W | W | 601.9 | W | W | W | W | 481.0 | W | W | 473.3 |
| 2005 | 390.3 | 412.5 | 374.2 | 388.1 | 390.9 | 430.2 | 433.6 | 455.1 | 335.3 | 314.4 | 361.0 | 414.8 |
| 2006 | 375.3 | 409.4 | 381.6 | W | 372.6 | 382.4 | W | W | 315.8 | 332.9 | W | W |
| 2007 | W | W | W | W | W | W | W | W | W | W | W | W |
| 2008 | W | W | W | W | W | W | W | W | W | W | W | 279.9 |
| 2009 | W | W | W | W | W | W | W | W | W | W | W | W |
| 2010 | W | W | W | W | W | W | W | W | W | W | W | W |
| 2011 | W | W | W | W | W | W | W | W | W | W | W | W |
| 2012 | W | W | W | W | W | W | W | W | W | W | W | W |
| 2013 | W | W | W | W | 169.1 | 177.5 | 189.5 | 177.9 | 164.8 | 184.7 | 168.0 | 177.5 |
| 2014 | 166.5 | 160.9 | 152.5 | 162.6 | 165.8 | 156.0 | 148.6 | 146.6 | 142.8 | 141.1 | 162.7 | 166.5 |
| 2015 | 159.4 | 175.1 | 195.9 | 171.2 | 173.9 | 176.3 | 181.3 | 152.2 | 157.5 | 170.7 | 158.8 | 155.8 |
| 2016 | 140.0 | 146.7 | 162.2 | 151.1 | 144.3 | 155.9 | 161.9 | 162.2 | 147.4 | 148.1 | 145.4 | 142.5 |
| 2017 | 133.8 | 133.1 | 137.9 | 141.8 | 158.4 | 166.5 | 175.7 | 158.4 | 144.9 | 138.5 | 136.6 | 127.4 |
| 2018 | 126.9 | 128.0 | 146.7 | 161.6 | 148.7 | 143.5 | 140.5 | 134.8 | 131.0 | 115.6 | 107.4 | 110.8 |
| 2019 | 122.3 | 124.0 | 137.3 | 132.5 | 123.6 | 126.7 | 143.8 | 137.0 | 131.9 | 136.5 | 105.8 | 115.8 |
| 2020 | 96.9 | 90.5 | 92.2 | 80.0 | 92.8 | 114.6 | 126.1 | 118.7 | 109.2 | 95.9 | 82.5 | W |
| 2021 | 89.2 | 94.8 | 109.0 | 106.7 | 112.4 | 138.0 | 129.9 | 112.4 | 99.5 | 101.5 | 89.9 | 87.7 |
| 2022 | 91.0 | 102.4 | 103.6 | |||||||||
| - = No Data Reported; -- = Not Applicable; NA = Not Available; W = Withheld to avoid disclosure of individual company data. |
| Release Date: 6/1/2022 |
| Next Release Date: TBD |