|
Download Data (XLS File) |
|
||||||||
|
||||||||
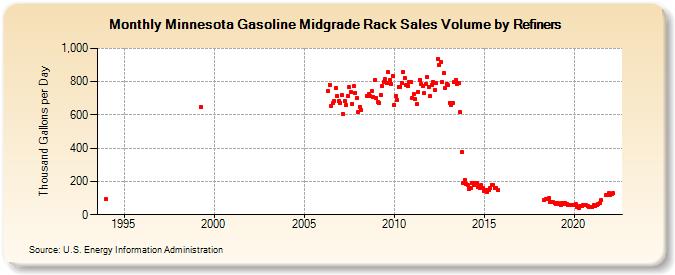
| Minnesota Gasoline Midgrade Rack Sales Volume by Refiners (Thousand Gallons per Day) | ||||||||
| Year | Jan | Feb | Mar | Apr | May | Jun | Jul | Aug | Sep | Oct | Nov | Dec |
|---|---|---|---|---|---|---|---|---|---|---|---|---|
| 1994 | 91.5 | W | W | W | W | W | W | W | W | W | W | W |
| 1995 | W | W | W | W | W | W | W | W | W | W | W | W |
| 1996 | W | W | W | W | W | W | W | W | W | W | W | W |
| 1997 | W | W | W | W | W | W | W | W | W | W | W | W |
| 1998 | W | W | W | W | W | W | W | W | W | W | W | W |
| 1999 | W | W | W | 645.4 | W | W | W | W | W | W | W | W |
| 2000 | W | W | W | W | W | W | W | W | W | W | W | W |
| 2001 | W | W | W | W | W | W | W | W | W | W | W | W |
| 2002 | W | W | W | W | W | W | W | W | W | W | W | W |
| 2003 | W | W | W | W | W | W | W | W | W | W | W | W |
| 2004 | W | W | W | W | W | W | W | W | W | W | W | W |
| 2005 | W | W | W | W | W | W | W | W | W | W | W | W |
| 2006 | W | W | W | W | 743.9 | 782.1 | 652.5 | 668.7 | 683.7 | 764.8 | 712.1 | 684.1 |
| 2007 | 670.6 | 719.9 | 605.8 | 681.5 | 658.8 | 710.8 | 766.0 | 736.1 | 668.0 | 771.1 | 731.8 | 702.1 |
| 2008 | 618.8 | 648.3 | 629.9 | W | W | W | 711.1 | 724.5 | 711.9 | 742.2 | 706.8 | 808.9 |
| 2009 | 699.4 | 679.8 | 671.9 | 721.4 | 770.9 | 797.1 | 813.9 | 790.5 | 855.5 | 811.5 | 786.5 | 836.2 |
| 2010 | 661.7 | 712.5 | 688.9 | 770.4 | 769.9 | 793.5 | 859.9 | 824.7 | 782.6 | 774.9 | 797.2 | 797.7 |
| 2011 | 704.6 | 723.0 | 693.9 | 665.4 | 740.2 | 811.9 | 785.0 | 771.9 | 729.3 | 786.0 | 827.3 | 767.3 |
| 2012 | 715.0 | 780.6 | 799.1 | 752.6 | 790.1 | 934.8 | 902.9 | 920.7 | 800.9 | 853.3 | 760.0 | 787.5 |
| 2013 | 777.6 | 673.5 | 659.7 | 669.8 | 798.7 | 807.3 | 783.0 | 794.8 | 615.9 | 378.5 | 190.1 | 210.5 |
| 2014 | 181.9 | 178.4 | 156.4 | 162.0 | 190.9 | 179.1 | 192.5 | 189.0 | 167.1 | 162.5 | 176.2 | 159.9 |
| 2015 | 144.6 | 146.4 | 134.6 | 149.8 | 162.3 | 180.2 | 177.4 | 159.3 | 159.9 | 150.2 | W | W |
| 2016 | W | W | W | W | W | W | W | W | W | W | W | W |
| 2017 | W | W | W | W | W | W | W | W | W | W | W | W |
| 2018 | W | W | W | W | 87.5 | 95.3 | 91.7 | 100.2 | 75.9 | 75.7 | 74.8 | 70.2 |
| 2019 | 66.0 | 68.0 | 64.0 | 56.3 | 69.7 | 65.9 | 71.7 | 64.1 | 59.6 | 57.3 | 61.3 | 58.1 |
| 2020 | 57.4 | 61.9 | 48.7 | 39.6 | 50.3 | 49.6 | 58.1 | 55.8 | 56.7 | 52.5 | 44.4 | 43.5 |
| 2021 | 44.3 | 57.7 | 52.7 | 56.6 | 61.9 | 71.2 | 85.9 | W | W | 118.4 | 121.0 | 130.3 |
| 2022 | 119.5 | 122.2 | 127.8 | |||||||||
| - = No Data Reported; -- = Not Applicable; NA = Not Available; W = Withheld to avoid disclosure of individual company data. |
| Release Date: 6/1/2022 |
| Next Release Date: TBD |