|
Download Data (XLS File) |
|
||||||||
|
||||||||
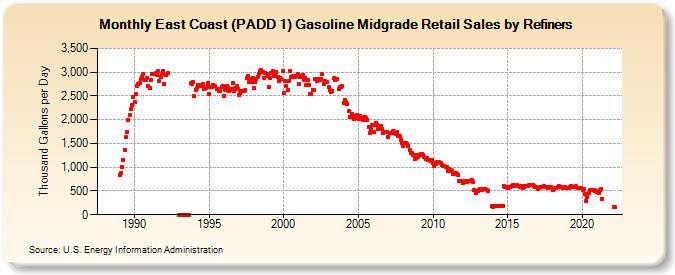
| East Coast (PADD 1) Gasoline Midgrade Retail Sales by Refiners (Thousand Gallons per Day) | ||||||||
| Year | Jan | Feb | Mar | Apr | May | Jun | Jul | Aug | Sep | Oct | Nov | Dec |
|---|---|---|---|---|---|---|---|---|---|---|---|---|
| 1988 | NA | NA | NA | NA | NA | NA | NA | NA | NA | NA | NA | NA |
| 1989 | 828.9 | 881.2 | 1,008.8 | 1,160.6 | 1,371.1 | 1,627.9 | 1,747.4 | 1,986.3 | 2,093.7 | 2,216.5 | 2,306.6 | 2,470.1 |
| 1990 | 2,364.7 | 2,530.8 | 2,710.6 | 2,753.6 | 2,780.6 | 2,857.2 | 2,887.8 | 2,971.3 | 2,826.2 | 2,838.1 | 2,872.4 | 2,716.6 |
| 1991 | 2,666.0 | 2,834.1 | 2,951.4 | 2,955.4 | 2,952.4 | 2,976.1 | 2,937.6 | 3,017.8 | 2,812.4 | 2,898.0 | 2,953.0 | 3,032.0 |
| 1992 | 2,755.9 | 2,943.2 | W | 2,974.8 | W | W | W | W | W | W | W | W |
| 1993 | 0.0 | 0.0 | 0.0 | 0.0 | 0.0 | 0.0 | 0.0 | 0.0 | 0.0 | 2,764.3 | 2,755.5 | 2,793.2 |
| 1994 | 2,506.1 | 2,631.2 | 2,673.2 | 2,721.6 | 2,719.8 | 2,703.3 | 2,702.2 | 2,753.4 | 2,639.0 | 2,664.7 | 2,679.4 | 2,773.8 |
| 1995 | 2,545.3 | 2,697.3 | 2,688.9 | 2,737.5 | 2,707.1 | 2,708.6 | 2,635.3 | 2,636.5 | 2,611.9 | 2,609.8 | 2,686.0 | 2,717.6 |
| 1996 | 2,499.3 | 2,631.9 | 2,705.0 | 2,669.8 | 2,595.4 | 2,632.9 | 2,652.5 | 2,777.1 | 2,607.4 | 2,675.9 | 2,713.0 | 2,646.9 |
| 1997 | 2,521.2 | 2,556.0 | 2,611.1 | 2,600.1 | 2,595.2 | 2,622.1 | 2,868.3 | 2,921.5 | 2,786.5 | 2,852.5 | 2,796.0 | 2,883.1 |
| 1998 | 2,676.6 | 2,783.7 | 2,856.5 | 2,906.5 | 2,967.8 | 3,031.2 | 3,035.1 | 2,999.2 | 2,882.3 | 2,990.2 | 2,928.7 | 2,959.2 |
| 1999 | 2,693.9 | 2,885.6 | 2,982.0 | 3,020.1 | 2,926.0 | 2,946.5 | 3,011.1 | 2,892.3 | 2,803.3 | 2,885.2 | 2,858.9 | 3,021.0 |
| 2000 | 2,567.7 | 2,810.2 | 2,711.4 | 2,626.9 | 2,815.4 | 3,022.2 | 2,897.2 | 2,915.6 | 2,889.9 | 2,898.9 | 2,910.0 | 2,965.0 |
| 2001 | 2,759.1 | 2,890.6 | 2,927.9 | 2,938.4 | 2,842.1 | 2,877.6 | 2,738.6 | 2,827.9 | 2,737.2 | 2,540.6 | 2,544.6 | 2,622.5 |
| 2002 | 2,632.7 | 2,846.2 | 2,854.9 | 2,810.0 | 2,851.9 | 2,833.0 | 2,852.7 | 2,956.9 | 2,753.0 | 2,824.0 | 2,790.5 | 2,796.6 |
| 2003 | 2,696.6 | 2,623.1 | 2,582.5 | 2,601.6 | 2,874.1 | 2,838.7 | 2,861.0 | 2,861.9 | 2,654.2 | 2,694.0 | 2,678.0 | 2,698.7 |
| 2004 | 2,360.9 | 2,414.2 | 2,365.2 | 2,339.6 | 2,173.6 | 2,063.9 | 2,062.0 | 2,111.2 | 2,006.4 | 2,079.1 | 2,033.2 | 2,095.1 |
| 2005 | 2,007.4 | 2,084.0 | 2,046.9 | 2,030.6 | 1,984.2 | 2,045.9 | 2,027.4 | 1,999.2 | 1,849.3 | 1,711.8 | 1,801.0 | 1,893.6 |
| 2006 | 1,750.3 | 1,888.4 | 1,937.8 | 1,896.5 | 1,803.8 | 1,861.7 | 1,874.2 | 1,803.7 | 1,720.4 | 1,744.4 | 1,734.6 | 1,738.0 |
| 2007 | 1,638.7 | 1,722.1 | 1,729.1 | 1,724.0 | 1,753.7 | 1,714.1 | 1,696.8 | 1,734.8 | 1,664.4 | 1,659.1 | 1,580.4 | 1,511.1 |
| 2008 | 1,441.8 | 1,512.2 | 1,503.2 | 1,488.3 | 1,446.3 | 1,362.0 | 1,303.9 | 1,297.8 | 1,258.1 | 1,178.9 | 1,201.9 | 1,264.3 |
| 2009 | 1,215.9 | 1,265.4 | 1,277.6 | 1,269.2 | 1,253.1 | 1,217.6 | 1,181.0 | 1,199.8 | 1,153.2 | 1,149.8 | 1,129.8 | 1,142.1 |
| 2010 | 1,080.5 | 1,034.6 | 1,073.1 | 1,105.6 | 1,104.7 | 1,104.5 | 1,090.3 | 1,056.6 | 1,015.9 | 1,023.2 | 1,008.6 | 1,003.5 |
| 2011 | 915.8 | 951.9 | 939.2 | 916.5 | 866.0 | 875.2 | 886.6 | 852.5 | 845.2 | 717.9 | 714.5 | 714.2 |
| 2012 | 660.1 | 694.2 | 701.5 | 691.9 | 701.4 | 717.8 | 704.1 | 723.4 | 688.2 | 526.0 | 450.5 | 503.5 |
| 2013 | 495.6 | 525.4 | 532.6 | 526.3 | 544.5 | 533.4 | 531.5 | 528.6 | 505.4 | NA | NA | 174.3 |
| 2014 | 170.7 | 175.5 | 186.1 | 183.1 | 188.0 | 189.9 | 184.5 | 189.8 | 188.9 | 602.4 | 588.1 | 582.1 |
| 2015 | 564.2 | 578.3 | 587.5 | 607.9 | 622.1 | 610.2 | 612.5 | 614.8 | 603.3 | 612.0 | 592.0 | 594.2 |
| 2016 | 565.9 | 592.2 | 596.5 | 604.4 | 606.5 | 627.6 | 621.4 | 623.6 | 616.1 | 604.1 | 581.8 | 578.0 |
| 2017 | 532.9 | 554.9 | 578.7 | 586.6 | 583.8 | 602.2 | 587.7 | 588.1 | 568.8 | 582.0 | 575.7 | 580.5 |
| 2018 | 524.7 | 546.9 | 566.7 | 569.0 | 572.8 | 593.9 | 577.0 | 587.2 | 569.4 | 571.3 | 581.8 | 560.5 |
| 2019 | 553.3 | 557.1 | 577.3 | 601.0 | 585.5 | 589.6 | 589.0 | 596.4 | 561.5 | 564.4 | 571.4 | 552.1 |
| 2020 | 527.8 | 540.6 | 443.4 | 290.6 | 372.6 | 458.2 | 514.5 | 517.6 | 511.0 | 516.4 | 492.8 | 491.2 |
| 2021 | 472.7 | 467.1 | 510.2 | 532.7 | 333.0 | W | W | W | W | W | W | W |
| 2022 | NA | 159.7 | 152.0 | |||||||||
| - = No Data Reported; -- = Not Applicable; NA = Not Available; W = Withheld to avoid disclosure of individual company data. |
| Release Date: 6/1/2022 |
| Next Release Date: TBD |