|
Download Data (XLS File) |
|
||||||||
|
||||||||
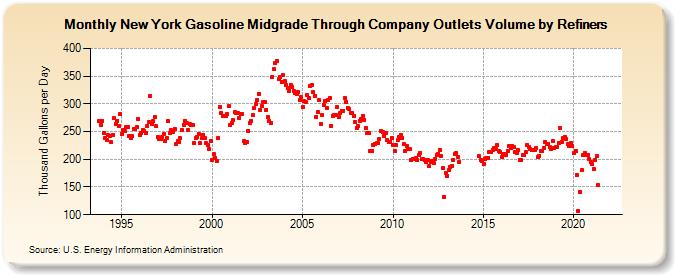
| New York Gasoline Midgrade Through Company Outlets Volume by Refiners (Thousand Gallons per Day) | ||||||||
| Year | Jan | Feb | Mar | Apr | May | Jun | Jul | Aug | Sep | Oct | Nov | Dec |
|---|---|---|---|---|---|---|---|---|---|---|---|---|
| 1993 | 269.7 | 262.2 | 269.6 | |||||||||
| 1994 | 246.5 | 238.5 | 235.2 | 243.6 | 242.5 | 230.3 | 244.6 | 273.6 | 264.1 | 269.7 | 260.8 | 280.8 |
| 1995 | 246.4 | 252.5 | 250.8 | 257.9 | 258.4 | 241.6 | 238.8 | 241.4 | 254.7 | 253.9 | 258.8 | 272.7 |
| 1996 | 243.3 | 247.4 | 253.3 | 250.3 | 247.1 | 259.3 | 267.3 | 314.8 | 263.3 | 268.5 | 276.7 | 259.5 |
| 1997 | 240.3 | 236.1 | 235.8 | 240.2 | 246.1 | 233.4 | 237.9 | 268.2 | 246.9 | 252.0 | 249.4 | 255.1 |
| 1998 | 227.7 | 232.8 | 231.4 | 237.7 | 252.6 | 262.6 | 269.9 | 264.6 | 252.1 | 263.8 | 261.3 | 262.5 |
| 1999 | 229.2 | 238.3 | 239.4 | 246.1 | 228.5 | 237.5 | 243.4 | 238.2 | 228.6 | 225.1 | 218.5 | 233.3 |
| 2000 | 198.6 | 208.8 | 202.9 | 196.5 | 238.5 | 294.2 | 283.5 | 278.9 | 277.5 | 278.8 | 281.9 | 295.5 |
| 2001 | 261.0 | 265.4 | 270.0 | 284.9 | 282.8 | 282.6 | 274.8 | 281.0 | 282.1 | 232.1 | 229.4 | 231.6 |
| 2002 | 251.4 | 265.5 | 269.6 | 279.6 | 292.8 | 298.8 | 307.6 | 318.5 | 288.2 | 295.7 | 304.2 | 303.2 |
| 2003 | 289.2 | 275.5 | 268.7 | 265.0 | 348.1 | 362.3 | 372.8 | 377.7 | 344.4 | 348.1 | 338.6 | 351.8 |
| 2004 | 341.0 | 334.1 | 329.3 | 323.9 | 334.5 | 329.9 | 322.5 | 320.1 | 317.3 | 321.4 | 306.1 | 312.5 |
| 2005 | 293.9 | 304.5 | 303.0 | 316.1 | 310.5 | 332.3 | 333.5 | 321.5 | 314.6 | 276.7 | 285.0 | 306.9 |
| 2006 | 263.7 | 280.6 | 298.7 | 304.4 | 292.2 | 307.7 | 310.3 | 260.3 | 278.9 | 279.8 | 279.4 | 295.0 |
| 2007 | 275.5 | 283.9 | 287.9 | 287.3 | 310.5 | 302.7 | 293.1 | 290.4 | 284.0 | 283.7 | 278.4 | 267.5 |
| 2008 | 257.1 | 259.7 | 269.8 | 272.4 | 278.2 | 271.7 | 257.1 | 246.7 | 246.7 | 214.5 | 215.4 | 225.2 |
| 2009 | 227.5 | 228.5 | 230.1 | 237.4 | 250.6 | 249.9 | 242.0 | 247.6 | 234.1 | 230.6 | 231.2 | 238.9 |
| 2010 | 226.6 | 214.2 | 226.1 | 234.6 | 240.5 | 244.0 | 239.1 | 227.4 | 215.5 | 223.4 | 219.0 | 218.9 |
| 2011 | 198.0 | 201.3 | 200.5 | 201.9 | 198.6 | 207.3 | 211.7 | 201.0 | 200.4 | 197.9 | 195.7 | 198.3 |
| 2012 | 187.0 | 195.0 | 196.7 | 192.5 | 200.2 | 208.6 | 210.4 | 216.3 | 205.2 | 185.0 | 132.8 | 175.4 |
| 2013 | 170.5 | 180.4 | 186.5 | 188.2 | 199.3 | 209.5 | 211.5 | 204.5 | 195.4 | NA | NA | W |
| 2014 | W | W | W | W | W | W | W | W | W | 205.5 | 198.5 | 197.6 |
| 2015 | 191.4 | 201.3 | 201.5 | 202.8 | 213.2 | 212.7 | 217.5 | 221.0 | 218.6 | 226.0 | 215.4 | 213.9 |
| 2016 | 203.2 | 209.5 | 209.9 | 208.5 | 214.7 | 224.8 | 220.8 | 223.8 | 221.4 | 213.7 | 210.8 | 216.2 |
| 2017 | 198.7 | 198.2 | 207.5 | 207.5 | 212.4 | 226.6 | 222.9 | 218.2 | 216.1 | 217.6 | 216.3 | 220.3 |
| 2018 | 203.6 | 206.2 | 214.8 | 215.5 | 220.1 | 231.4 | 228.1 | 228.3 | 221.6 | 218.4 | 233.2 | 220.5 |
| 2019 | 223.0 | 221.7 | 228.8 | 255.6 | 230.9 | 238.3 | 239.8 | 236.3 | 227.4 | 223.6 | 229.2 | 223.4 |
| 2020 | 211.3 | 215.6 | 171.8 | 106.8 | 141.8 | 180.0 | 207.3 | 211.4 | 208.0 | 208.4 | 200.1 | 194.6 |
| 2021 | 190.9 | 182.4 | 198.3 | 205.5 | 152.9 | W | W | W | W | W | W | W |
| 2022 | W | W | W | |||||||||
| - = No Data Reported; -- = Not Applicable; NA = Not Available; W = Withheld to avoid disclosure of individual company data. |
| Release Date: 6/1/2022 |
| Next Release Date: TBD |