|
Download Data (XLS File) |
|
||||||||
|
||||||||
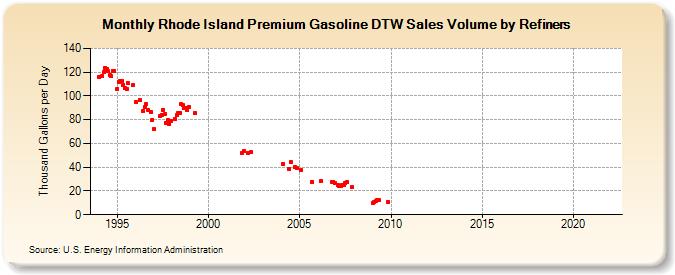
| Rhode Island Premium Gasoline DTW Sales Volume by Refiners (Thousand Gallons per Day) | ||||||||
| Year | Jan | Feb | Mar | Apr | May | Jun | Jul | Aug | Sep | Oct | Nov | Dec |
|---|---|---|---|---|---|---|---|---|---|---|---|---|
| 1994 | 115.6 | W | 116.9 | 120.2 | 123.8 | 122.3 | 120.7 | 117.2 | 116.4 | 121.2 | 120.8 | W |
| 1995 | 106.1 | 111.4 | 112.5 | 112.3 | 109.4 | 106.6 | 105.8 | 110.8 | W | W | 108.8 | W |
| 1996 | 94.9 | W | W | 96.5 | W | 87.4 | 90.4 | 93.0 | 88.3 | W | 86.6 | 80.1 |
| 1997 | 71.8 | W | W | W | 82.9 | 84.0 | 88.0 | 84.4 | 77.5 | 79.5 | 76.2 | 78.5 |
| 1998 | W | W | 80.8 | 83.8 | 86.0 | 85.9 | 93.4 | 92.5 | 89.8 | 90.0 | 88.1 | 90.8 |
| 1999 | W | W | W | 85.6 | W | W | W | W | W | W | W | W |
| 2000 | W | W | W | W | W | W | W | W | W | W | W | W |
| 2001 | W | W | W | W | W | W | W | W | W | W | 52.3 | 53.6 |
| 2002 | W | W | 52.0 | W | 52.7 | W | W | W | W | W | W | W |
| 2003 | W | W | W | W | W | W | W | W | W | W | W | W |
| 2004 | W | 42.9 | W | W | W | 38.5 | 44.4 | W | W | 39.9 | 39.0 | W |
| 2005 | W | 37.3 | W | W | W | W | W | W | 27.9 | W | W | W |
| 2006 | W | W | 28.3 | W | W | W | W | W | W | 27.4 | 27.7 | 26.6 |
| 2007 | W | 25.0 | 24.2 | 24.4 | 25.0 | 24.6 | 26.9 | 27.5 | W | W | 23.1 | W |
| 2008 | W | W | W | W | W | W | W | W | W | W | W | W |
| 2009 | 10.0 | 10.6 | 11.4 | 12.0 | 12.0 | W | W | W | W | W | 10.9 | W |
| 2010 | W | W | W | W | W | W | W | NA | W | W | W | W |
| 2011 | W | W | W | W | W | W | W | W | W | W | W | W |
| 2012 | W | W | W | W | W | W | W | W | W | W | W | W |
| 2013 | W | W | W | W | W | W | W | W | W | W | W | W |
| 2014 | W | W | W | W | W | W | W | W | W | W | W | W |
| 2015 | W | W | W | W | W | W | W | W | W | W | W | W |
| 2016 | W | W | W | W | W | W | W | W | W | W | W | W |
| 2017 | W | W | W | W | W | W | W | W | W | - | - | - |
| 2018 | - | - | - | - | - | - | - | - | - | - | - | - |
| 2019 | - | - | - | - | - | - | - | - | - | - | - | - |
| 2020 | - | - | - | - | - | - | - | - | - | - | - | - |
| 2021 | - | - | - | - | - | - | - | - | - | - | - | - |
| 2022 | - | - | - | |||||||||
| - = No Data Reported; -- = Not Applicable; NA = Not Available; W = Withheld to avoid disclosure of individual company data. |
| Release Date: 6/1/2022 |
| Next Release Date: TBD |