|
Download Data (XLS File) |
|
||||||||
|
||||||||
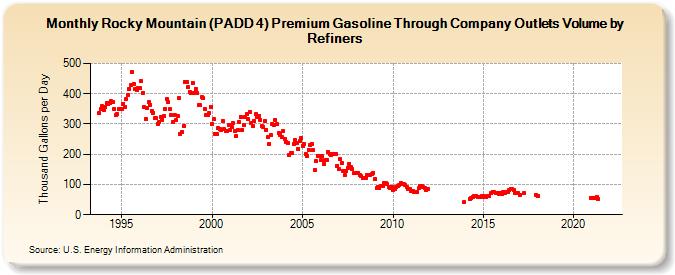
| Rocky Mountain (PADD 4) Premium Gasoline Through Company Outlets Volume by Refiners (Thousand Gallons per Day) | ||||||||
| Year | Jan | Feb | Mar | Apr | May | Jun | Jul | Aug | Sep | Oct | Nov | Dec |
|---|---|---|---|---|---|---|---|---|---|---|---|---|
| 1993 | 337.0 | 348.8 | 358.1 | |||||||||
| 1994 | 347.1 | 356.5 | 368.8 | 364.4 | 369.8 | 374.7 | 371.9 | 351.1 | 328.4 | 332.1 | 347.9 | 349.0 |
| 1995 | 349.5 | 367.3 | 357.5 | 382.3 | 396.7 | 416.7 | 427.3 | 472.9 | 433.2 | 416.4 | 413.4 | 418.7 |
| 1996 | 418.8 | 441.2 | 404.0 | 354.5 | 316.5 | 353.5 | 373.2 | 364.3 | 343.0 | 337.2 | 319.4 | 318.2 |
| 1997 | 300.8 | 307.6 | 323.4 | 314.3 | 325.6 | 350.6 | 382.6 | 372.9 | 348.5 | 328.5 | 307.9 | 330.2 |
| 1998 | 312.3 | 326.2 | 384.5 | 268.5 | 274.0 | 292.8 | 440.2 | 440.0 | 421.3 | 405.8 | 400.9 | 436.7 |
| 1999 | 401.1 | 417.2 | 404.0 | 362.1 | 361.5 | 388.6 | 385.7 | 349.8 | 330.8 | 329.8 | 334.8 | 357.6 |
| 2000 | 301.5 | 314.8 | 267.1 | 265.8 | 285.8 | 283.0 | 280.7 | 310.1 | 282.2 | 275.2 | 277.2 | 297.8 |
| 2001 | 281.2 | 288.4 | 301.7 | 277.1 | 258.6 | 280.4 | 305.9 | 324.3 | 281.5 | 296.1 | 323.2 | 332.6 |
| 2002 | 315.1 | 340.6 | 302.5 | 294.8 | 310.5 | 332.0 | 322.6 | 328.0 | 313.8 | 291.8 | 290.2 | 310.6 |
| 2003 | 280.9 | 258.3 | 233.9 | 262.3 | 301.5 | 295.3 | 314.1 | 298.5 | 269.8 | 263.8 | 255.6 | 276.0 |
| 2004 | 251.7 | 240.7 | 237.2 | 198.3 | 202.4 | 204.6 | 234.5 | 246.9 | 235.6 | 217.7 | 242.1 | 253.9 |
| 2005 | 228.2 | 233.0 | 201.5 | 195.0 | 214.9 | 229.6 | 232.2 | 213.1 | 148.1 | 177.0 | 194.5 | 193.8 |
| 2006 | 179.6 | 192.6 | 169.2 | 181.9 | 180.1 | 207.0 | 200.7 | 198.5 | 199.8 | 202.0 | 202.1 | 162.0 |
| 2007 | 149.6 | 183.0 | 171.4 | 145.2 | 131.2 | 146.0 | 155.4 | 168.6 | 157.7 | 151.3 | 136.9 | 138.5 |
| 2008 | 136.6 | 138.7 | 131.6 | 127.1 | 121.9 | 120.3 | 121.8 | 132.1 | 129.8 | 131.5 | 134.3 | 139.2 |
| 2009 | 118.7 | 88.0 | 91.8 | 87.7 | 94.8 | 95.8 | 104.8 | 104.2 | 100.0 | 92.1 | 87.6 | 90.1 |
| 2010 | 82.7 | 85.2 | 91.5 | 94.9 | 99.0 | 105.1 | 102.3 | 101.1 | 97.8 | 92.1 | 86.2 | 85.5 |
| 2011 | 78.6 | 77.6 | 75.8 | 76.3 | 76.4 | 86.8 | 95.8 | 95.6 | 92.2 | 86.9 | 83.3 | 85.9 |
| 2012 | W | W | W | W | W | W | W | W | W | W | W | W |
| 2013 | W | W | W | W | W | W | W | W | W | W | W | 40.9 |
| 2014 | W | W | W | 50.6 | 56.3 | 58.6 | 62.0 | 61.7 | 57.7 | 57.1 | 58.3 | 61.6 |
| 2015 | 62.3 | 58.4 | 59.9 | 62.1 | 62.5 | 71.3 | 76.4 | 74.0 | 73.0 | 72.3 | 69.8 | 71.4 |
| 2016 | 70.0 | 74.4 | 71.2 | 74.1 | 74.0 | 80.8 | 86.2 | 84.5 | 80.5 | 72.6 | 71.7 | 72.9 |
| 2017 | 66.7 | W | W | 71.2 | W | W | W | W | W | W | W | 66.7 |
| 2018 | 62.8 | W | W | W | W | W | W | W | W | W | W | W |
| 2019 | W | W | W | W | W | W | W | W | W | W | W | W |
| 2020 | W | W | W | W | W | W | W | W | W | W | W | 56.5 |
| 2021 | 56.5 | 56.4 | 56.0 | 59.9 | 53.5 | W | W | W | W | W | W | W |
| 2022 | W | W | W | |||||||||
| - = No Data Reported; -- = Not Applicable; NA = Not Available; W = Withheld to avoid disclosure of individual company data. |
| Release Date: 6/1/2022 |
| Next Release Date: TBD |