|
Download Data (XLS File) |
|
||||||||
|
||||||||
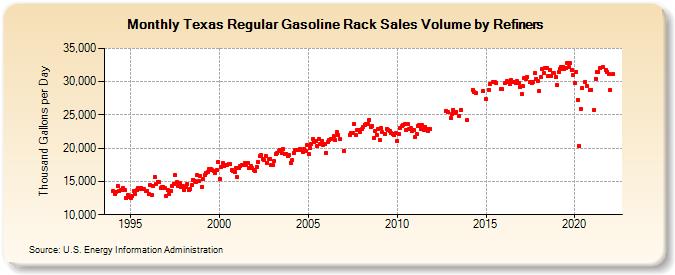
| Texas Regular Gasoline Rack Sales Volume by Refiners (Thousand Gallons per Day) | ||||||||
| Year | Jan | Feb | Mar | Apr | May | Jun | Jul | Aug | Sep | Oct | Nov | Dec |
|---|---|---|---|---|---|---|---|---|---|---|---|---|
| 1994 | 13,552.6 | 13,104.4 | 13,464.7 | 14,357.1 | 13,572.5 | 13,690.7 | 13,715.6 | 14,050.8 | 13,715.3 | 12,444.3 | 13,007.7 | 12,591.0 |
| 1995 | 12,580.1 | 12,866.7 | 13,552.5 | 13,139.0 | 13,685.9 | 14,062.6 | 13,820.2 | 14,076.5 | 13,836.1 | 13,811.7 | 13,598.9 | 13,564.4 |
| 1996 | 13,046.6 | 14,461.4 | 12,975.1 | 14,379.5 | 15,700.0 | 14,623.6 | 14,989.9 | 14,882.7 | 14,065.4 | 14,114.1 | 14,134.0 | 13,960.6 |
| 1997 | 12,799.2 | 13,750.7 | 13,180.6 | 13,571.9 | 14,294.8 | 14,663.2 | 15,945.4 | 14,889.8 | 14,331.4 | 14,698.0 | 14,145.3 | 14,343.6 |
| 1998 | 13,645.5 | 14,204.6 | 14,576.8 | 13,770.5 | 13,858.5 | 14,436.5 | 15,275.0 | 15,030.5 | 14,890.5 | 15,968.1 | 15,104.7 | 15,838.6 |
| 1999 | 14,227.4 | 15,394.8 | 16,011.0 | 16,344.5 | 16,448.5 | 16,880.3 | 16,899.5 | 16,671.5 | 16,630.7 | 16,285.0 | 16,674.4 | 17,878.9 |
| 2000 | 15,304.5 | 17,172.8 | 17,706.3 | 17,254.0 | 17,484.3 | 17,539.6 | 17,617.3 | 17,561.2 | 16,729.7 | 16,605.8 | 16,465.3 | 17,094.8 |
| 2001 | 15,617.5 | 16,972.7 | 17,306.3 | 17,486.5 | 17,422.1 | 17,757.8 | 17,498.4 | 17,766.0 | 17,041.7 | 17,301.1 | 16,962.6 | 16,685.4 |
| 2002 | 16,536.2 | 17,235.3 | 17,956.0 | 18,782.4 | 18,909.4 | 18,391.6 | 18,238.3 | 18,837.5 | 17,845.9 | 18,399.2 | 18,300.6 | 17,451.2 |
| 2003 | 17,407.0 | 18,016.0 | 19,106.5 | 19,250.1 | 19,510.6 | 19,744.3 | 19,232.7 | 19,842.5 | 19,139.2 | 19,194.9 | 18,893.4 | 18,904.3 |
| 2004 | 17,827.5 | 18,169.4 | 19,300.0 | 19,707.5 | 19,788.1 | 19,706.4 | 19,881.3 | 19,714.3 | 19,475.1 | 19,862.7 | 19,607.7 | 20,433.5 |
| 2005 | 19,110.3 | 20,035.5 | 20,689.5 | 21,380.7 | 20,946.4 | 21,119.9 | 20,402.5 | 21,412.9 | 20,699.7 | 21,132.0 | 20,535.6 | 20,572.4 |
| 2006 | 19,303.5 | 20,901.9 | 21,212.7 | 21,352.1 | W | 21,797.5 | 21,250.4 | 22,370.1 | 22,009.1 | 21,398.4 | W | W |
| 2007 | 19,608.0 | W | W | W | 22,037.4 | 22,290.5 | 22,235.9 | 23,645.9 | 21,942.9 | 22,673.2 | 22,679.3 | 22,481.3 |
| 2008 | 22,842.1 | 23,176.0 | 23,538.1 | 23,677.4 | 23,678.4 | 24,268.6 | 23,223.2 | 23,331.5 | 21,512.5 | 22,573.2 | 22,054.6 | 22,850.8 |
| 2009 | 21,279.6 | 23,067.3 | 22,382.7 | W | 22,170.3 | 22,923.4 | 22,768.5 | 22,580.4 | 22,239.4 | 22,079.2 | 21,908.3 | 22,230.1 |
| 2010 | 21,129.2 | 22,160.4 | 23,031.7 | 23,307.1 | 23,449.1 | 23,587.1 | 22,673.5 | 23,571.3 | 22,811.5 | 22,974.5 | 22,636.1 | 22,796.0 |
| 2011 | 21,625.9 | 22,099.0 | 23,357.0 | 23,539.4 | 22,917.9 | 23,423.9 | 22,697.4 | 23,242.6 | 22,827.8 | 22,654.5 | 22,911.5 | W |
| 2012 | W | W | W | W | W | W | W | W | W | 25,647.1 | 25,488.9 | W |
| 2013 | 24,466.5 | 25,078.4 | 25,771.8 | 25,363.2 | 25,511.4 | W | 24,879.9 | 25,801.0 | W | W | W | 24,263.7 |
| 2014 | W | W | W | 28,793.6 | 28,379.7 | 28,343.4 | W | W | W | W | 28,603.2 | W |
| 2015 | 27,336.2 | W | 28,793.4 | 29,659.5 | W | 29,923.9 | 29,901.2 | 29,757.2 | W | W | 28,823.2 | 28,826.3 |
| 2016 | W | 29,752.8 | 30,053.7 | 29,903.1 | 29,645.3 | 30,277.6 | 29,979.6 | 29,875.3 | 29,756.1 | 30,074.5 | 29,725.2 | 29,132.5 |
| 2017 | 28,123.1 | 29,288.4 | 30,489.7 | 30,412.9 | 30,725.9 | W | 30,018.5 | 29,820.8 | 29,998.4 | 31,302.7 | 30,427.4 | 30,069.1 |
| 2018 | 28,653.5 | 30,636.0 | 31,851.0 | 31,262.1 | 32,076.1 | 32,053.4 | 30,811.0 | 31,808.3 | 30,866.5 | 31,245.9 | 31,226.5 | 30,691.8 |
| 2019 | 29,532.4 | 31,427.0 | 31,967.2 | 32,168.7 | 32,211.6 | 31,954.1 | 32,044.4 | 32,856.8 | 32,179.8 | 32,733.1 | 31,718.4 | 30,989.9 |
| 2020 | 29,748.7 | 31,464.6 | 27,313.9 | 20,362.1 | 25,894.2 | 29,045.3 | W | 29,957.5 | 29,379.8 | W | 28,726.0 | 28,812.9 |
| 2021 | W | 25,803.4 | 30,439.3 | 31,523.2 | 31,502.5 | 32,093.6 | W | 32,151.0 | W | 31,780.8 | 31,513.9 | 31,109.5 |
| 2022 | 28,731.5 | W | 31,131.6 | |||||||||
| - = No Data Reported; -- = Not Applicable; NA = Not Available; W = Withheld to avoid disclosure of individual company data. |
| Release Date: 6/1/2022 |
| Next Release Date: TBD |