|
Download Data (XLS File) |
|
||||||||
|
||||||||
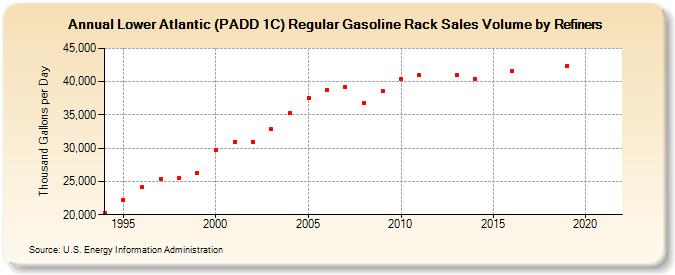
| Lower Atlantic (PADD 1C) Regular Gasoline Rack Sales Volume by Refiners (Thousand Gallons per Day) | ||||||||
| Decade | Year-0 | Year-1 | Year-2 | Year-3 | Year-4 | Year-5 | Year-6 | Year-7 | Year-8 | Year-9 |
|---|---|---|---|---|---|---|---|---|---|---|
| 1990's | 20,253.7 | 22,278.8 | 24,095.7 | 25,442.6 | 25,518.0 | 26,315.5 | ||||
| 2000's | 29,661.6 | 30,998.8 | 30,893.3 | 32,826.0 | 35,325.8 | 37,565.5 | 38,803.5 | 39,179.2 | 36,747.7 | 38,595.4 |
| 2010's | 40,415.7 | 40,941.7 | W | 41,011.7 | 40,345.6 | W | 41,546.2 | W | W | 42,397.3 |
| 2020's | W |
| - = No Data Reported; -- = Not Applicable; NA = Not Available; W = Withheld to avoid disclosure of individual company data. |
| Release Date: 6/1/2022 |
| Next Release Date: TBD |