|
Download Data (XLS File) |
|
||||||||
|
||||||||
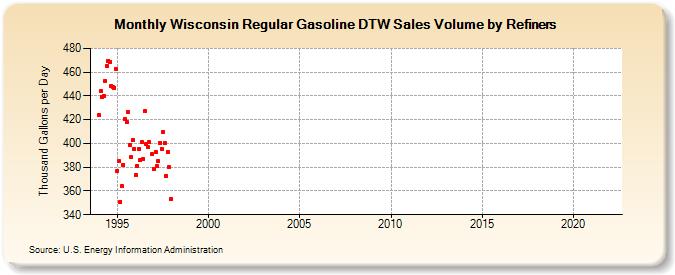
| Wisconsin Regular Gasoline DTW Sales Volume by Refiners (Thousand Gallons per Day) | ||||||||
| Year | Jan | Feb | Mar | Apr | May | Jun | Jul | Aug | Sep | Oct | Nov | Dec |
|---|---|---|---|---|---|---|---|---|---|---|---|---|
| 1994 | 424.0 | 444.2 | 439.4 | 440.3 | 452.9 | 465.4 | 469.6 | 468.8 | 448.6 | 447.6 | 446.9 | 462.5 |
| 1995 | 376.6 | 384.8 | 351.0 | 363.9 | 382.2 | 420.2 | 417.8 | 426.3 | 398.7 | 388.4 | 403.3 | 395.4 |
| 1996 | 373.3 | 381.4 | 395.7 | 385.9 | 401.1 | 387.3 | 427.2 | 399.8 | 396.7 | 400.8 | W | 390.8 |
| 1997 | 378.7 | 392.6 | 380.8 | 385.0 | 400.5 | 395.7 | 409.9 | 400.2 | 372.8 | 392.9 | 379.8 | 353.4 |
| 1998 | W | W | W | W | W | W | W | W | W | W | W | W |
| 1999 | W | W | W | W | W | W | W | W | W | W | W | W |
| 2000 | W | W | W | W | W | W | W | W | W | W | W | W |
| 2001 | W | W | W | W | W | W | W | W | W | W | W | W |
| 2002 | W | W | W | W | W | W | W | W | W | W | W | W |
| 2003 | W | W | W | W | W | W | W | W | W | W | W | W |
| 2004 | W | W | W | W | W | W | W | - | - | - | - | - |
| 2005 | W | - | - | - | - | - | - | - | - | - | - | - |
| 2006 | W | - | W | W | W | W | W | W | W | - | - | - |
| 2007 | - | - | - | - | - | - | - | - | - | - | - | - |
| 2008 | - | - | - | - | - | - | - | W | - | W | W | W |
| 2009 | W | W | W | W | NA | - | - | - | - | - | - | - |
| 2010 | - | - | - | - | - | - | - | - | - | - | - | - |
| 2011 | - | - | - | - | - | - | - | - | - | - | - | - |
| 2012 | - | - | - | - | - | - | - | - | - | - | - | - |
| 2013 | - | - | - | - | - | - | - | - | - | - | - | - |
| 2014 | - | - | - | - | - | - | - | - | - | - | - | - |
| 2015 | - | - | - | - | - | - | - | - | - | - | W | W |
| 2016 | W | W | W | W | W | W | W | W | W | W | W | W |
| 2017 | W | W | W | W | W | W | W | W | W | W | W | W |
| 2018 | W | W | W | NA | - | - | - | - | - | - | - | - |
| 2019 | - | - | - | - | - | - | - | - | - | - | - | - |
| 2020 | - | - | - | - | - | - | - | - | - | - | - | - |
| 2021 | - | - | - | - | - | - | - | - | - | - | - | - |
| 2022 | - | - | - | |||||||||
| - = No Data Reported; -- = Not Applicable; NA = Not Available; W = Withheld to avoid disclosure of individual company data. |
| Release Date: 6/1/2022 |
| Next Release Date: TBD |