|
Download Data (XLS File) |
|
||||||||
|
||||||||
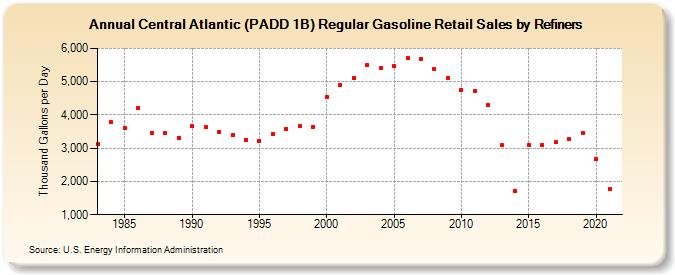
| Central Atlantic (PADD 1B) Regular Gasoline Retail Sales by Refiners (Thousand Gallons per Day) | ||||||||
| Decade | Year-0 | Year-1 | Year-2 | Year-3 | Year-4 | Year-5 | Year-6 | Year-7 | Year-8 | Year-9 |
|---|---|---|---|---|---|---|---|---|---|---|
| 1980's | 3,137.0 | 3,774.3 | 3,613.9 | 4,196.9 | 3,460.1 | 3,446.6 | 3,314.3 | |||
| 1990's | 3,655.9 | 3,632.8 | 3,491.9 | 3,394.4 | 3,251.5 | 3,230.0 | 3,427.7 | 3,585.3 | 3,655.5 | 3,644.8 |
| 2000's | 4,540.4 | 4,884.9 | 5,111.5 | 5,505.9 | 5,398.3 | 5,467.2 | 5,714.2 | 5,673.4 | 5,367.0 | 5,121.2 |
| 2010's | 4,757.6 | 4,709.5 | 4,294.6 | 3,086.4 | 1,713.5 | 3,101.2 | 3,101.3 | 3,171.2 | 3,271.5 | 3,451.7 |
| 2020's | 2,677.6 |
| - = No Data Reported; -- = Not Applicable; NA = Not Available; W = Withheld to avoid disclosure of individual company data. |
| Release Date: 6/1/2022 |
| Next Release Date: TBD |