|
Download Data (XLS File) |
|
||||||||
|
||||||||
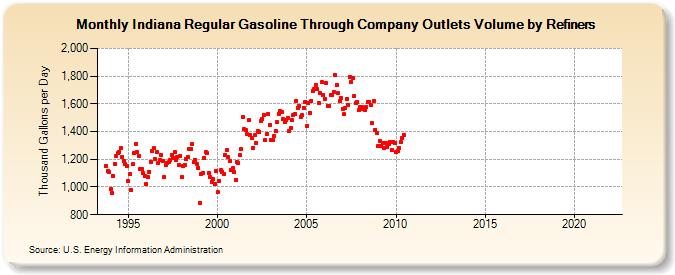
| Indiana Regular Gasoline Through Company Outlets Volume by Refiners (Thousand Gallons per Day) | ||||||||
| Year | Jan | Feb | Mar | Apr | May | Jun | Jul | Aug | Sep | Oct | Nov | Dec |
|---|---|---|---|---|---|---|---|---|---|---|---|---|
| 1993 | 1,152.8 | 1,114.9 | 1,111.6 | |||||||||
| 1994 | 982.0 | 955.8 | 1,081.1 | 1,167.5 | 1,223.8 | 1,243.7 | 1,254.1 | 1,278.6 | 1,214.6 | 1,189.1 | 1,166.0 | 1,154.8 |
| 1995 | 1,042.7 | 1,090.6 | 981.5 | 1,163.1 | 1,244.1 | 1,308.8 | 1,249.8 | 1,223.1 | 1,127.8 | 1,132.6 | 1,099.3 | 1,076.5 |
| 1996 | 1,019.5 | 1,069.3 | 1,111.4 | 1,183.0 | 1,257.5 | 1,280.5 | 1,203.1 | 1,251.5 | 1,171.6 | 1,193.1 | 1,229.7 | 1,185.8 |
| 1997 | 1,069.4 | 1,156.4 | 1,176.4 | 1,178.0 | 1,194.2 | 1,233.0 | 1,209.1 | 1,250.1 | 1,197.4 | 1,218.5 | 1,159.8 | 1,223.9 |
| 1998 | 1,071.9 | 1,151.9 | 1,157.7 | 1,201.9 | 1,215.5 | 1,275.9 | 1,272.7 | 1,309.9 | 1,178.3 | 1,198.3 | 1,168.0 | 1,140.2 |
| 1999 | 888.1 | 1,092.1 | 1,098.7 | 1,207.6 | 1,249.2 | 1,242.8 | 1,101.8 | 1,072.9 | 1,033.8 | 1,059.3 | 1,023.0 | 1,119.0 |
| 2000 | 961.5 | 1,044.9 | 1,119.6 | 1,110.9 | 1,094.5 | 1,229.2 | 1,264.8 | 1,215.7 | 1,185.0 | 1,125.9 | 1,136.2 | 1,107.6 |
| 2001 | 1,053.2 | 1,181.5 | 1,174.5 | 1,227.7 | 1,272.1 | 1,502.6 | 1,416.5 | 1,409.2 | 1,380.3 | 1,484.7 | 1,376.4 | 1,352.5 |
| 2002 | 1,282.1 | 1,373.9 | 1,316.6 | 1,400.6 | 1,399.9 | 1,477.1 | 1,491.1 | 1,516.1 | 1,342.6 | 1,379.2 | 1,530.1 | 1,449.2 |
| 2003 | 1,342.0 | 1,340.2 | 1,367.5 | 1,403.4 | 1,466.0 | 1,527.2 | 1,549.8 | 1,540.1 | 1,487.4 | 1,471.3 | 1,485.4 | 1,496.8 |
| 2004 | 1,402.8 | 1,425.5 | 1,481.1 | 1,521.4 | 1,527.7 | 1,621.1 | 1,572.8 | 1,587.3 | 1,506.8 | 1,516.1 | 1,571.3 | 1,615.6 |
| 2005 | 1,439.6 | 1,602.8 | 1,537.4 | 1,622.0 | 1,691.7 | 1,704.6 | 1,735.0 | 1,705.1 | 1,605.0 | 1,676.3 | 1,754.4 | 1,666.9 |
| 2006 | 1,638.0 | 1,748.1 | 1,586.5 | 1,587.7 | 1,665.7 | 1,661.9 | 1,687.7 | 1,805.3 | 1,737.6 | 1,675.0 | 1,617.1 | 1,642.0 |
| 2007 | 1,563.3 | 1,524.7 | 1,572.9 | 1,637.8 | 1,592.5 | 1,796.4 | 1,759.5 | 1,788.6 | 1,657.3 | 1,604.9 | 1,610.8 | 1,554.5 |
| 2008 | 1,580.2 | 1,573.7 | 1,566.1 | 1,555.1 | 1,577.4 | 1,611.8 | 1,615.6 | 1,593.2 | 1,458.9 | 1,622.1 | 1,413.5 | 1,388.7 |
| 2009 | 1,292.5 | 1,333.1 | 1,299.0 | 1,319.4 | 1,284.2 | 1,318.4 | 1,292.0 | 1,313.3 | 1,327.9 | 1,266.5 | 1,327.3 | 1,315.5 |
| 2010 | 1,250.0 | 1,258.0 | 1,280.4 | 1,322.9 | 1,356.2 | 1,377.4 | W | W | W | W | W | W |
| 2011 | W | W | W | W | W | W | W | W | W | W | W | W |
| 2012 | W | W | W | W | W | W | W | W | W | W | W | W |
| 2013 | W | W | W | W | W | W | W | W | W | W | W | W |
| 2014 | W | W | W | W | W | W | W | W | W | W | W | W |
| 2015 | W | W | W | W | W | W | W | W | W | W | W | W |
| 2016 | W | W | W | W | W | W | W | W | W | W | W | W |
| 2017 | W | W | W | W | W | W | W | W | W | W | W | W |
| 2018 | W | W | W | W | W | W | W | W | W | W | W | W |
| 2019 | W | W | W | W | W | W | W | W | W | W | W | W |
| 2020 | W | W | W | W | W | W | W | W | W | W | W | W |
| 2021 | W | W | W | W | W | - | - | - | - | - | - | - |
| 2022 | W | W | W | |||||||||
| - = No Data Reported; -- = Not Applicable; NA = Not Available; W = Withheld to avoid disclosure of individual company data. |
| Release Date: 6/1/2022 |
| Next Release Date: TBD |