|
Download Data (XLS File) |
|
||||||||
|
||||||||
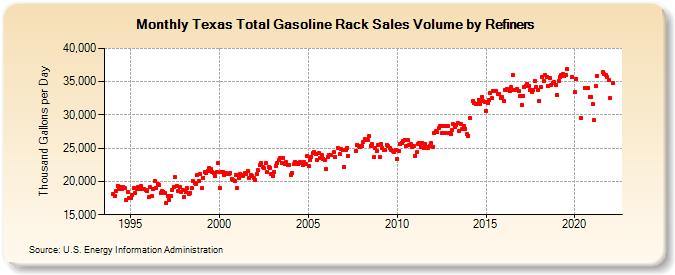
| Texas Total Gasoline Rack Sales Volume by Refiners (Thousand Gallons per Day) | ||||||||
| Year | Jan | Feb | Mar | Apr | May | Jun | Jul | Aug | Sep | Oct | Nov | Dec |
|---|---|---|---|---|---|---|---|---|---|---|---|---|
| 1994 | 18,149.1 | 17,810.0 | 18,623.1 | 19,377.3 | 18,844.9 | 19,126.2 | 18,832.2 | 19,129.2 | 18,953.3 | 17,201.6 | 18,436.1 | 17,504.1 |
| 1995 | 17,570.5 | 17,898.2 | 19,016.0 | 18,247.8 | 18,879.6 | 19,233.0 | 18,850.1 | 19,338.7 | 18,860.3 | 18,862.5 | 18,683.1 | 18,588.2 |
| 1996 | 17,683.9 | 19,198.2 | 17,805.4 | 18,936.5 | 20,120.1 | 19,071.7 | 19,613.4 | 19,433.1 | 18,286.6 | 18,491.7 | 18,430.7 | 18,199.2 |
| 1997 | 16,693.6 | 17,866.8 | 17,276.6 | 17,747.9 | 18,731.6 | 19,168.6 | 20,619.0 | 19,373.6 | 18,591.5 | 19,095.8 | 18,425.9 | 18,703.1 |
| 1998 | 17,727.1 | 18,401.7 | 18,989.5 | 18,086.2 | 18,311.5 | 19,006.0 | 20,113.9 | 19,759.0 | 19,661.9 | 20,954.0 | 20,019.0 | 21,135.3 |
| 1999 | 18,984.7 | 20,577.7 | 21,390.5 | 21,251.6 | 21,497.7 | 22,016.1 | 21,945.9 | 21,447.2 | 21,263.0 | 20,762.3 | 21,355.8 | 22,724.2 |
| 2000 | 19,026.1 | 21,377.9 | 21,471.6 | 21,010.1 | 21,295.8 | 21,146.7 | 21,139.7 | 21,299.4 | 20,374.2 | 20,181.4 | 20,083.5 | 20,978.8 |
| 2001 | 19,011.7 | 20,580.3 | 21,102.8 | 21,029.4 | 20,879.6 | 21,288.3 | 21,174.4 | 21,508.6 | 20,548.8 | 20,997.0 | 20,847.2 | 20,583.8 |
| 2002 | 20,241.3 | 21,115.5 | 21,732.0 | 22,420.5 | 22,716.6 | 22,164.5 | 21,954.2 | 22,705.9 | 21,429.4 | 22,106.1 | 22,056.7 | 21,188.4 |
| 2003 | 20,820.0 | 21,410.8 | 22,292.7 | 22,748.1 | 23,223.9 | 23,468.9 | 22,821.7 | 23,576.8 | 22,647.0 | 22,870.9 | 22,407.7 | 22,517.0 |
| 2004 | 21,038.4 | 21,342.4 | 22,566.9 | 22,968.2 | 22,734.9 | 22,563.0 | 22,872.8 | 22,813.8 | 22,545.2 | 22,858.6 | 22,663.7 | 23,757.8 |
| 2005 | 22,250.2 | 23,223.5 | 23,723.5 | 24,220.8 | 24,363.8 | 24,141.4 | 23,246.6 | 24,253.4 | 23,514.2 | 23,977.8 | 23,377.5 | 23,282.4 |
| 2006 | 21,797.5 | 23,691.9 | 23,993.7 | 24,037.5 | W | 24,363.3 | 23,729.2 | W | 24,979.2 | 24,098.4 | 24,910.5 | 24,662.9 |
| 2007 | 22,113.2 | 24,725.0 | 25,070.1 | 23,828.5 | W | W | W | W | 24,512.5 | 25,470.2 | 25,301.8 | 25,181.2 |
| 2008 | 25,330.4 | 25,972.9 | 26,317.4 | 26,286.9 | 26,267.3 | 26,765.0 | 25,353.0 | 25,558.4 | 23,603.2 | 24,989.0 | 24,564.7 | 25,551.9 |
| 2009 | 23,694.1 | 25,638.6 | 25,041.2 | 24,668.3 | 24,721.1 | 25,503.3 | 25,305.1 | 25,088.1 | 24,786.1 | 24,547.9 | 24,387.4 | 24,725.3 |
| 2010 | 23,413.1 | 24,625.1 | 25,575.0 | 25,853.9 | 26,119.6 | 26,261.3 | 25,257.0 | 26,247.6 | 25,468.3 | 25,597.2 | 25,229.8 | 25,272.0 |
| 2011 | 23,865.2 | 24,379.6 | 25,642.3 | 25,806.2 | 25,128.8 | 25,810.1 | 25,019.6 | 25,611.1 | 25,230.2 | 25,047.8 | 25,348.2 | 25,774.1 |
| 2012 | 25,241.0 | 27,240.6 | 27,553.4 | 27,412.5 | 27,989.9 | 28,368.1 | 27,239.8 | 28,303.4 | 27,286.3 | 28,402.6 | 28,370.6 | 27,299.2 |
| 2013 | 27,099.5 | 27,698.6 | 28,565.7 | 28,229.0 | 28,448.9 | 28,833.8 | 27,654.4 | 28,703.7 | 27,908.7 | 28,381.6 | 27,931.7 | 27,063.4 |
| 2014 | 26,877.2 | 29,474.2 | W | 32,039.1 | 31,763.1 | 31,658.4 | 31,624.4 | 32,315.4 | 31,583.9 | 32,684.3 | 32,071.3 | 32,006.6 |
| 2015 | 30,661.5 | 31,737.1 | 32,229.4 | 33,283.2 | 32,480.1 | 33,598.3 | 33,588.1 | 33,570.0 | 33,146.4 | 33,114.0 | 32,580.7 | 32,624.3 |
| 2016 | 32,068.7 | 33,680.7 | 33,894.1 | 33,755.7 | 33,596.4 | 34,149.9 | 35,937.5 | 33,761.8 | 33,758.5 | 33,893.5 | 33,557.2 | 32,788.0 |
| 2017 | 31,562.4 | 32,899.4 | 34,242.6 | 34,313.5 | 34,694.8 | 34,379.6 | 33,820.7 | 33,473.6 | 33,685.9 | 35,100.6 | 34,261.2 | 33,766.2 |
| 2018 | 32,063.6 | 34,236.4 | 35,711.7 | 35,059.0 | 35,950.0 | 35,746.9 | 34,393.4 | 35,555.4 | 34,518.7 | 34,865.5 | 34,998.5 | 34,428.9 |
| 2019 | 33,054.6 | 35,148.2 | 35,725.4 | 36,017.4 | 36,091.8 | 35,848.5 | 35,935.1 | 36,867.3 | W | W | 35,702.4 | W |
| 2020 | 33,451.5 | 35,414.1 | W | W | 29,501.3 | W | W | 34,045.3 | W | 34,011.6 | 32,764.3 | 32,750.6 |
| 2021 | 31,702.0 | 29,247.5 | 34,375.0 | 35,861.9 | W | W | W | 36,431.1 | 36,120.4 | 35,970.2 | 35,639.4 | 35,191.5 |
| 2022 | 32,472.2 | W | 34,749.3 | |||||||||
| - = No Data Reported; -- = Not Applicable; NA = Not Available; W = Withheld to avoid disclosure of individual company data. |
| Release Date: 6/1/2022 |
| Next Release Date: TBD |