|
Download Data (XLS File) |
|
||||||||
|
||||||||
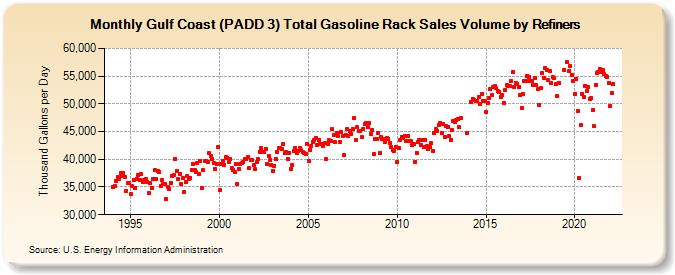
| Gulf Coast (PADD 3) Total Gasoline Rack Sales Volume by Refiners (Thousand Gallons per Day) | ||||||||
| Year | Jan | Feb | Mar | Apr | May | Jun | Jul | Aug | Sep | Oct | Nov | Dec |
|---|---|---|---|---|---|---|---|---|---|---|---|---|
| 1994 | 35,032.7 | 35,165.9 | 36,117.8 | 36,786.4 | 36,518.4 | 37,467.1 | 36,935.0 | 37,444.6 | 36,814.6 | 34,248.3 | 35,714.5 | 35,744.5 |
| 1995 | 33,702.0 | 35,097.3 | 36,284.4 | 34,874.0 | 36,492.9 | 37,149.4 | 36,181.5 | 37,272.2 | 35,814.9 | 36,286.5 | 36,355.4 | 35,904.7 |
| 1996 | 34,000.4 | 35,718.3 | 34,743.7 | 36,531.5 | 37,978.0 | 36,377.4 | 37,919.7 | 37,653.8 | 35,233.2 | 36,256.9 | 35,531.7 | 35,596.1 |
| 1997 | 32,809.0 | 34,915.0 | 34,635.0 | 35,803.1 | 37,066.0 | 37,112.4 | 40,054.0 | 37,948.3 | 36,516.6 | 37,378.5 | 35,517.7 | 36,587.5 |
| 1998 | 34,114.0 | 35,882.2 | 36,985.1 | 36,354.4 | 36,628.3 | 38,115.8 | 39,129.8 | 37,983.3 | 37,772.7 | 39,326.2 | 37,340.3 | 39,614.3 |
| 1999 | 34,807.8 | 37,982.1 | 39,676.3 | 39,770.3 | 39,518.9 | 41,064.5 | 40,564.4 | 40,020.8 | 39,315.6 | 38,265.1 | 39,173.2 | 42,262.8 |
| 2000 | 34,487.1 | 39,171.1 | 39,720.0 | 38,996.0 | 40,366.3 | 40,186.1 | 39,464.8 | 40,091.8 | 38,379.1 | 38,130.7 | 37,793.7 | 39,224.3 |
| 2001 | 35,468.9 | 38,242.5 | 39,159.4 | 39,287.9 | 39,475.1 | 40,059.7 | 39,987.0 | 40,492.5 | 38,349.6 | 39,797.8 | 39,832.6 | 38,918.7 |
| 2002 | 38,191.2 | 39,463.8 | 40,030.1 | 41,362.3 | 41,955.4 | 41,247.4 | 41,286.8 | 41,882.1 | 39,213.0 | 40,612.9 | 39,903.2 | 39,038.0 |
| 2003 | 37,945.1 | 38,811.9 | 40,079.8 | 41,222.4 | 42,111.5 | 42,065.6 | 41,798.4 | 42,807.3 | 41,057.2 | 41,271.3 | 40,001.9 | 41,220.3 |
| 2004 | 38,308.6 | 39,003.6 | 41,464.3 | 42,016.5 | 41,207.5 | 41,556.1 | 42,093.0 | 41,602.2 | 41,320.8 | 41,151.4 | 40,988.6 | 42,841.7 |
| 2005 | 39,756.4 | 41,722.4 | 42,409.8 | 43,120.2 | 43,511.5 | 43,748.1 | 42,635.1 | 43,537.7 | 42,733.5 | 42,697.4 | 42,369.6 | 42,938.7 |
| 2006 | 40,018.5 | 42,801.7 | 43,405.9 | 43,304.4 | 45,400.1 | 44,324.3 | 43,068.6 | 44,789.0 | 44,169.1 | 43,079.0 | 44,965.2 | 44,164.3 |
| 2007 | 40,766.0 | 44,393.7 | 45,419.1 | 44,119.3 | 45,053.2 | 44,583.0 | 45,432.6 | 47,481.6 | 43,561.2 | 45,762.4 | 45,152.6 | 45,139.2 |
| 2008 | 44,039.8 | 45,528.6 | 46,279.2 | 46,475.2 | 45,773.3 | 46,471.8 | 44,580.9 | 45,308.1 | 40,937.4 | 43,658.4 | 43,697.6 | 44,764.4 |
| 2009 | 41,136.6 | 44,018.5 | 43,641.3 | 43,626.9 | 43,058.6 | 43,892.8 | 43,708.0 | 43,007.3 | 42,180.7 | 41,657.7 | 41,417.2 | 42,275.7 |
| 2010 | 39,485.1 | 41,963.5 | 43,540.8 | 44,058.3 | 43,914.3 | 44,279.2 | 43,380.2 | 44,119.3 | 43,332.5 | 43,219.5 | 42,526.7 | 42,690.1 |
| 2011 | 39,541.9 | 41,221.1 | 43,182.6 | 43,506.8 | 42,490.0 | 43,527.0 | 42,181.7 | 43,476.5 | 42,392.6 | 41,873.4 | 42,269.5 | 42,861.1 |
| 2012 | 41,565.8 | 44,654.0 | 45,485.5 | 45,070.9 | 46,105.0 | 46,583.0 | 44,730.6 | 46,308.8 | 43,989.1 | 45,959.1 | 45,739.6 | 44,131.4 |
| 2013 | 43,526.8 | 45,338.5 | 46,937.6 | 46,648.2 | 47,075.5 | 47,240.0 | 45,775.6 | 47,523.0 | W | W | W | 44,687.9 |
| 2014 | W | W | 50,329.7 | 50,956.5 | 50,659.8 | 50,453.6 | 50,569.8 | 51,194.7 | 49,983.4 | 51,792.0 | 50,468.9 | 50,485.0 |
| 2015 | 48,549.6 | 50,106.6 | 51,125.2 | 52,587.3 | 51,612.0 | 53,001.7 | 53,272.1 | 52,819.5 | 52,236.2 | 52,114.8 | 51,208.6 | 51,564.0 |
| 2016 | 50,155.7 | 52,533.8 | 53,359.1 | 53,239.0 | 53,141.1 | 54,113.5 | 55,664.7 | 53,099.4 | 53,819.8 | 53,506.8 | 53,066.2 | 51,509.5 |
| 2017 | 49,285.5 | 51,697.5 | 54,154.7 | 54,149.8 | 55,096.7 | 54,909.5 | 54,086.3 | 54,071.2 | 53,338.8 | 54,595.3 | 53,415.6 | 52,662.7 |
| 2018 | 49,715.9 | 52,804.6 | 55,567.3 | 54,624.9 | 56,471.2 | 56,187.1 | 54,334.6 | 55,933.9 | 53,759.8 | 54,828.4 | 54,578.6 | 53,516.2 |
| 2019 | 51,342.4 | 53,804.9 | W | W | W | 56,180.6 | W | 57,494.6 | 55,984.4 | 56,862.5 | 55,260.0 | 54,181.1 |
| 2020 | 51,803.8 | 54,488.0 | 48,741.1 | 36,603.2 | 46,116.3 | 51,845.0 | 51,261.7 | 53,221.4 | 52,386.8 | 52,986.6 | 50,906.4 | 50,996.6 |
| 2021 | 48,889.7 | 45,949.5 | 53,454.4 | 55,591.7 | 55,781.2 | 56,340.0 | 55,823.5 | 56,141.5 | 55,373.7 | 55,053.4 | 54,840.1 | 53,800.3 |
| 2022 | 49,570.5 | 51,869.3 | 53,568.4 | |||||||||
| - = No Data Reported; -- = Not Applicable; NA = Not Available; W = Withheld to avoid disclosure of individual company data. |
| Release Date: 6/1/2022 |
| Next Release Date: TBD |