|
Download Data (XLS File) |
|
||||||||
|
||||||||
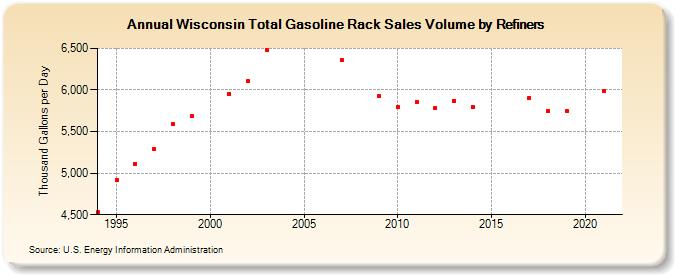
| Wisconsin Total Gasoline Rack Sales Volume by Refiners (Thousand Gallons per Day) | ||||||||
| Decade | Year-0 | Year-1 | Year-2 | Year-3 | Year-4 | Year-5 | Year-6 | Year-7 | Year-8 | Year-9 |
|---|---|---|---|---|---|---|---|---|---|---|
| 1990's | 4,529.4 | 4,916.4 | 5,112.9 | 5,289.5 | 5,588.2 | 5,685.0 | ||||
| 2000's | W | 5,956.8 | 6,102.5 | 6,482.6 | W | W | W | 6,359.6 | W | 5,930.3 |
| 2010's | 5,798.2 | 5,859.4 | 5,789.2 | 5,872.2 | 5,800.1 | W | W | 5,905.4 | 5,748.3 | 5,747.5 |
| 2020's | W |
| - = No Data Reported; -- = Not Applicable; NA = Not Available; W = Withheld to avoid disclosure of individual company data. |
| Release Date: 6/1/2022 |
| Next Release Date: TBD |