|
Download Data (XLS File) |
|
||||||||
|
||||||||
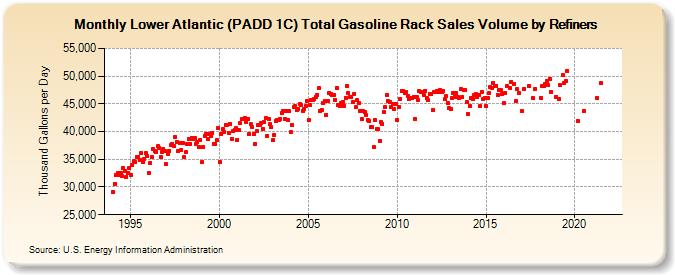
| Lower Atlantic (PADD 1C) Total Gasoline Rack Sales Volume by Refiners (Thousand Gallons per Day) | ||||||||
| Year | Jan | Feb | Mar | Apr | May | Jun | Jul | Aug | Sep | Oct | Nov | Dec |
|---|---|---|---|---|---|---|---|---|---|---|---|---|
| 1994 | 29,097.3 | 30,577.4 | 32,116.7 | 32,449.6 | 32,217.0 | 32,512.6 | 31,974.3 | 33,392.5 | 32,951.1 | 31,862.1 | 32,580.5 | 33,516.0 |
| 1995 | 32,167.5 | 33,929.5 | 34,620.7 | 34,572.5 | 35,483.7 | 35,454.1 | 34,806.0 | 36,120.2 | 34,435.7 | 35,117.3 | 36,129.4 | 35,537.5 |
| 1996 | 32,559.5 | 34,339.9 | 35,366.5 | 36,859.3 | 36,503.1 | 36,287.5 | 37,331.4 | 37,099.6 | 35,443.3 | 36,320.5 | 36,885.9 | 36,423.5 |
| 1997 | 34,086.9 | 35,940.1 | 36,504.0 | 37,488.3 | 37,800.6 | 37,452.3 | 39,003.8 | 38,039.5 | 36,576.4 | 37,871.9 | 36,671.2 | 37,889.2 |
| 1998 | 35,400.2 | 36,247.1 | 37,726.8 | 38,651.2 | 37,818.4 | 38,831.6 | 38,688.8 | 38,791.2 | 37,840.5 | 38,057.7 | 37,164.8 | 38,506.5 |
| 1999 | 34,489.5 | 37,256.9 | 39,165.5 | 39,474.9 | 38,581.8 | 39,648.4 | 39,218.7 | 39,704.0 | 37,833.4 | 37,802.1 | 38,489.8 | 40,659.4 |
| 2000 | 34,511.9 | 39,629.6 | 40,456.7 | 39,910.5 | 41,246.0 | 41,181.0 | 39,800.8 | 41,372.4 | 38,709.2 | 40,093.5 | 40,285.6 | 40,639.5 |
| 2001 | 38,559.1 | 40,346.2 | 41,487.6 | 42,188.9 | 42,223.9 | 42,406.3 | 41,704.7 | 42,202.0 | 39,521.0 | 41,287.7 | 40,791.3 | 39,601.7 |
| 2002 | 37,823.2 | 40,077.2 | 41,118.2 | 41,227.9 | 41,588.5 | 40,459.6 | 41,715.9 | 42,388.6 | 39,192.7 | 42,310.2 | 41,330.9 | 40,766.5 |
| 2003 | 38,427.5 | 39,381.5 | 41,964.1 | 42,138.9 | 42,125.3 | 42,308.6 | 43,340.3 | 43,694.4 | 42,232.4 | 43,671.9 | 42,127.7 | 43,630.8 |
| 2004 | 39,839.8 | 41,140.8 | 44,456.4 | 44,582.4 | 43,837.5 | 44,112.4 | 44,937.3 | 44,730.5 | 43,784.4 | 44,058.0 | 44,578.6 | 45,476.2 |
| 2005 | 42,006.3 | 44,797.7 | 45,724.8 | 45,616.7 | 45,843.3 | 46,249.7 | 46,672.3 | 47,778.5 | 43,673.5 | 43,860.6 | 45,201.3 | 45,493.1 |
| 2006 | 42,997.0 | 45,517.6 | 46,891.6 | 46,760.7 | 46,677.2 | 46,584.7 | 45,763.7 | 47,886.4 | 44,715.4 | 44,595.5 | 45,134.5 | 45,395.5 |
| 2007 | 44,625.4 | 46,118.8 | 48,194.1 | 46,983.6 | 46,276.4 | 46,166.1 | 45,291.8 | 46,837.6 | 44,437.3 | 45,616.5 | 45,189.8 | 43,734.5 |
| 2008 | 42,187.2 | 43,640.5 | 43,465.4 | 42,971.5 | 42,091.4 | 41,921.1 | 40,735.1 | 40,821.1 | 37,176.4 | 42,015.3 | 40,464.4 | 40,445.0 |
| 2009 | 38,383.1 | 41,688.4 | 41,405.7 | 43,448.3 | 44,341.6 | 46,641.7 | 45,532.7 | 45,305.5 | 44,511.2 | 44,891.4 | 44,136.6 | 45,044.0 |
| 2010 | 42,044.1 | 44,516.8 | 45,934.0 | 47,397.8 | 47,269.9 | 46,951.6 | 47,176.5 | 46,501.3 | 45,830.5 | 46,009.9 | 46,009.3 | 46,313.0 |
| 2011 | 42,295.4 | 46,178.0 | 45,624.0 | 47,265.8 | 47,098.8 | 47,070.9 | 46,604.9 | 47,327.6 | 45,995.8 | 45,683.5 | 46,837.2 | 46,735.8 |
| 2012 | 43,842.9 | 47,157.2 | 47,216.9 | 47,243.7 | 47,097.2 | 47,497.5 | 47,113.6 | 47,351.8 | 45,795.1 | 46,365.9 | 45,128.2 | 44,271.4 |
| 2013 | 44,022.8 | 46,000.6 | 46,921.8 | 46,293.8 | 46,879.0 | 46,227.6 | 46,080.1 | 47,614.7 | 46,189.1 | 47,572.0 | 47,407.3 | 45,271.1 |
| 2014 | 43,133.3 | 44,682.0 | 46,095.3 | 45,862.0 | 46,524.0 | 46,715.0 | 46,215.8 | 46,597.9 | 44,591.5 | 47,176.2 | 45,921.5 | 46,044.3 |
| 2015 | 44,600.4 | 46,034.7 | 46,936.6 | 48,100.0 | 47,908.7 | 48,726.1 | 48,293.6 | 48,292.1 | 46,670.3 | 47,463.4 | 47,407.5 | 46,855.9 |
| 2016 | 45,149.4 | 47,012.9 | 48,212.7 | W | 47,912.2 | 48,955.8 | W | 48,664.7 | 45,475.2 | 47,615.5 | 46,866.6 | W |
| 2017 | 43,673.4 | W | 47,738.4 | W | W | 48,168.5 | W | W | 45,998.8 | 47,759.3 | W | W |
| 2018 | W | 46,131.5 | 48,211.9 | 48,152.2 | 48,534.2 | 49,146.4 | 48,360.5 | 49,548.7 | 47,203.2 | W | W | 46,284.7 |
| 2019 | W | 45,865.2 | 48,386.2 | W | 50,182.6 | 48,683.4 | 49,123.1 | 50,917.5 | W | W | W | W |
| 2020 | W | W | 41,917.6 | W | W | W | 43,669.5 | W | W | W | W | W |
| 2021 | W | W | W | 46,090.9 | W | W | 48,667.9 | W | W | W | W | W |
| 2022 | W | W | W | |||||||||
| - = No Data Reported; -- = Not Applicable; NA = Not Available; W = Withheld to avoid disclosure of individual company data. |
| Release Date: 6/1/2022 |
| Next Release Date: TBD |