|
Download Data (XLS File) |
|
||||||||
|
||||||||
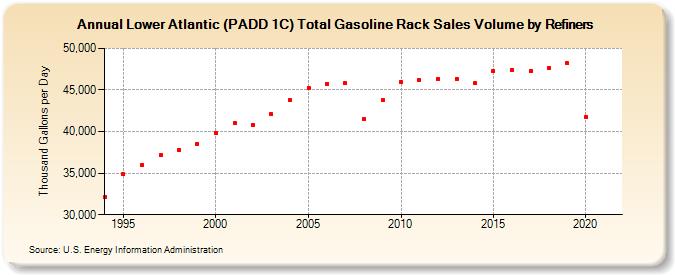
| Lower Atlantic (PADD 1C) Total Gasoline Rack Sales Volume by Refiners (Thousand Gallons per Day) | ||||||||
| Decade | Year-0 | Year-1 | Year-2 | Year-3 | Year-4 | Year-5 | Year-6 | Year-7 | Year-8 | Year-9 |
|---|---|---|---|---|---|---|---|---|---|---|
| 1990's | 32,110.8 | 34,869.1 | 35,955.9 | 37,120.7 | 37,819.8 | 38,533.8 | ||||
| 2000's | 39,818.6 | 41,030.1 | 40,842.6 | 42,107.9 | 43,803.9 | 45,247.4 | 45,744.6 | 45,787.6 | 41,492.2 | 43,784.7 |
| 2010's | 46,002.3 | 46,220.7 | 46,334.8 | 46,374.7 | 45,806.0 | 47,279.4 | 47,461.3 | 47,301.9 | 47,662.0 | 48,187.9 |
| 2020's | 41,809.0 |
| - = No Data Reported; -- = Not Applicable; NA = Not Available; W = Withheld to avoid disclosure of individual company data. |
| Release Date: 6/1/2022 |
| Next Release Date: TBD |