|
Download Data (XLS File) |
|
||||||||
|
||||||||
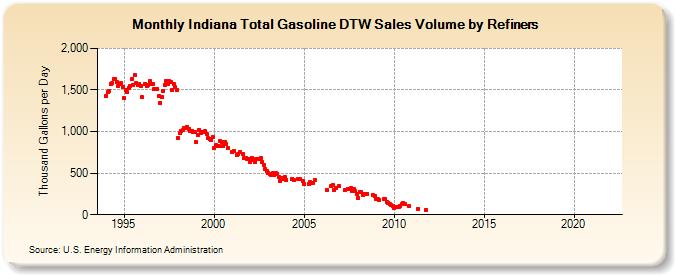
| Indiana Total Gasoline DTW Sales Volume by Refiners (Thousand Gallons per Day) | ||||||||
| Year | Jan | Feb | Mar | Apr | May | Jun | Jul | Aug | Sep | Oct | Nov | Dec |
|---|---|---|---|---|---|---|---|---|---|---|---|---|
| 1994 | 1,427.8 | 1,473.4 | 1,492.5 | 1,569.2 | 1,579.1 | 1,630.4 | 1,636.5 | 1,598.5 | 1,547.8 | 1,576.5 | 1,580.1 | 1,538.8 |
| 1995 | 1,404.5 | 1,502.6 | 1,470.3 | 1,523.5 | 1,551.9 | 1,631.1 | 1,563.3 | 1,678.0 | 1,582.2 | 1,555.4 | 1,568.9 | 1,548.1 |
| 1996 | 1,412.1 | W | 1,572.5 | 1,543.4 | 1,557.1 | 1,610.1 | 1,570.9 | 1,575.0 | 1,506.5 | 1,507.9 | 1,516.6 | 1,424.0 |
| 1997 | 1,345.5 | 1,416.8 | 1,493.2 | 1,562.7 | 1,612.8 | 1,577.3 | 1,605.8 | 1,590.5 | 1,495.4 | 1,566.5 | 1,534.4 | 1,498.6 |
| 1998 | 927.5 | 981.3 | 1,003.6 | 1,016.2 | 1,038.3 | 1,046.3 | 1,058.0 | 1,033.6 | 1,001.3 | 1,006.1 | 994.4 | 997.7 |
| 1999 | 876.2 | 957.4 | 1,021.4 | 988.0 | 992.2 | 991.5 | 1,003.0 | 968.1 | 921.2 | 914.7 | 904.4 | 929.3 |
| 2000 | 798.1 | 838.7 | 828.8 | 825.0 | 885.5 | 879.6 | 825.9 | 878.4 | 851.6 | 807.2 | W | W |
| 2001 | 752.1 | 765.1 | W | 723.6 | 725.7 | 753.7 | W | 734.2 | 676.1 | 687.3 | 669.5 | 664.2 |
| 2002 | 636.9 | 685.5 | 658.1 | 632.3 | 665.9 | 669.5 | 667.0 | 683.1 | 636.5 | 599.5 | 551.3 | 530.6 |
| 2003 | 503.1 | 495.2 | 483.2 | 498.2 | 481.0 | 505.1 | 490.7 | 452.3 | 406.1 | 442.5 | 431.7 | 454.5 |
| 2004 | 422.5 | W | W | W | 432.9 | 420.2 | W | W | 433.4 | 435.1 | W | 403.3 |
| 2005 | 364.6 | W | W | 371.3 | 390.5 | 383.7 | 379.1 | 422.2 | W | W | W | W |
| 2006 | W | W | W | 297.8 | W | W | 340.8 | 352.9 | 303.0 | 316.4 | W | 342.6 |
| 2007 | W | W | W | 296.9 | W | 304.7 | W | 316.4 | 290.0 | 304.1 | 284.5 | 249.2 |
| 2008 | 202.6 | 272.8 | 271.4 | 237.6 | 248.3 | W | 254.9 | W | W | W | 232.1 | 223.8 |
| 2009 | 194.1 | 187.0 | 180.9 | W | W | 191.2 | 188.2 | 155.4 | 135.1 | 123.1 | 111.9 | 103.5 |
| 2010 | 85.7 | 87.3 | 90.6 | 98.6 | 107.2 | 124.0 | 139.3 | 126.2 | W | W | 103.5 | W |
| 2011 | W | W | W | W | 73.7 | W | W | W | W | 61.8 | W | W |
| 2012 | W | W | W | W | W | W | W | W | W | W | W | W |
| 2013 | W | W | W | W | W | W | W | W | W | W | W | W |
| 2014 | W | W | W | W | W | W | W | W | W | W | W | W |
| 2015 | W | - | - | - | - | - | - | - | - | - | - | - |
| 2016 | - | - | - | - | - | - | - | - | - | - | - | - |
| 2017 | - | - | - | - | - | - | - | - | - | - | - | - |
| 2018 | - | - | - | - | - | - | - | - | - | - | - | - |
| 2019 | - | - | - | - | - | - | - | - | - | - | - | - |
| 2020 | - | - | - | - | - | - | - | - | - | - | - | - |
| 2021 | - | - | - | - | - | - | - | - | - | - | - | - |
| 2022 | - | - | - | |||||||||
| - = No Data Reported; -- = Not Applicable; NA = Not Available; W = Withheld to avoid disclosure of individual company data. |
| Release Date: 6/1/2022 |
| Next Release Date: TBD |