|
Download Data (XLS File) |
|
||||||||
|
||||||||
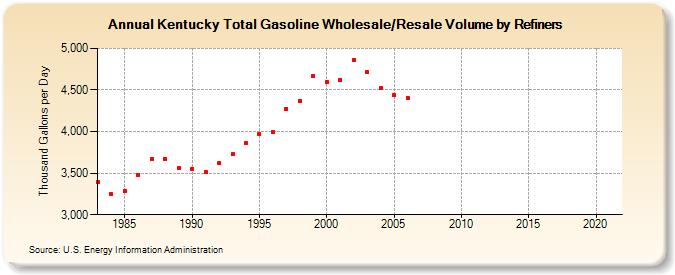
| Kentucky Total Gasoline Wholesale/Resale Volume by Refiners (Thousand Gallons per Day) | ||||||||
| Decade | Year-0 | Year-1 | Year-2 | Year-3 | Year-4 | Year-5 | Year-6 | Year-7 | Year-8 | Year-9 |
|---|---|---|---|---|---|---|---|---|---|---|
| 1980's | 3,395.3 | 3,248.1 | 3,286.6 | 3,483.1 | 3,665.8 | 3,675.7 | 3,558.0 | |||
| 1990's | 3,554.1 | 3,510.7 | 3,615.9 | 3,727.9 | 3,862.3 | 3,972.2 | 3,993.3 | 4,276.7 | 4,364.7 | 4,669.4 |
| 2000's | 4,596.2 | 4,619.1 | 4,865.3 | 4,715.7 | 4,522.6 | 4,441.1 | 4,408.3 | NA | NA | NA |
| 2010's | NA | NA | NA | NA | NA | NA | NA | NA | NA | NA |
| 2020's | NA |
| - = No Data Reported; -- = Not Applicable; NA = Not Available; W = Withheld to avoid disclosure of individual company data. |
| Release Date: 6/1/2022 |
| Next Release Date: TBD |