|
Download Data (XLS File) |
|
||||||||
|
||||||||
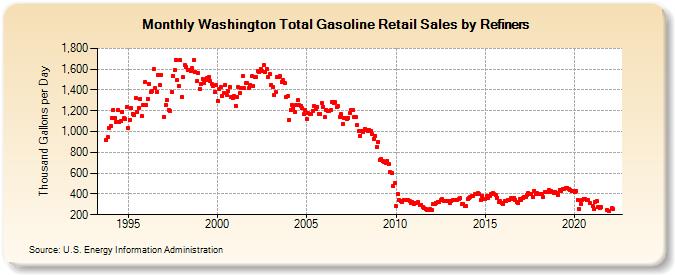
| Washington Total Gasoline Retail Sales by Refiners (Thousand Gallons per Day) | ||||||||
| Year | Jan | Feb | Mar | Apr | May | Jun | Jul | Aug | Sep | Oct | Nov | Dec |
|---|---|---|---|---|---|---|---|---|---|---|---|---|
| 1993 | 914.6 | 947.5 | 1,030.2 | |||||||||
| 1994 | 1,052.2 | 1,132.1 | 1,211.2 | 1,128.0 | 1,090.5 | 1,206.5 | 1,096.5 | 1,102.7 | 1,189.2 | 1,129.1 | 1,121.2 | 1,231.8 |
| 1995 | 1,037.6 | 1,115.3 | 1,224.7 | 1,173.1 | 1,158.9 | 1,318.2 | 1,188.0 | 1,224.7 | 1,313.4 | 1,147.5 | 1,257.5 | 1,472.2 |
| 1996 | 1,254.8 | 1,316.9 | 1,461.3 | 1,379.1 | 1,390.6 | 1,597.8 | 1,416.9 | 1,383.7 | 1,545.4 | 1,445.6 | 1,547.9 | NA |
| 1997 | 1,142.5 | 1,256.9 | 1,303.3 | 1,208.0 | 1,198.2 | 1,378.9 | 1,535.5 | 1,590.3 | 1,692.5 | 1,493.0 | 1,441.7 | 1,684.0 |
| 1998 | 1,332.4 | 1,524.9 | 1,635.7 | 1,624.9 | 1,593.6 | 1,592.9 | 1,578.0 | 1,608.7 | 1,683.8 | 1,576.5 | 1,482.2 | 1,564.0 |
| 1999 | 1,409.2 | 1,456.4 | 1,506.8 | 1,463.5 | 1,498.1 | 1,513.9 | 1,527.1 | 1,483.8 | 1,457.9 | 1,437.5 | 1,382.6 | 1,443.1 |
| 2000 | 1,297.1 | 1,408.8 | 1,428.5 | 1,339.6 | 1,369.2 | 1,447.8 | 1,355.9 | 1,388.5 | 1,428.8 | 1,336.7 | 1,322.9 | 1,340.9 |
| 2001 | 1,248.3 | 1,330.2 | 1,425.1 | 1,372.1 | 1,418.1 | 1,532.7 | 1,414.6 | 1,466.1 | 1,464.4 | 1,416.5 | 1,445.6 | 1,529.8 |
| 2002 | 1,436.8 | 1,528.7 | 1,521.0 | 1,583.8 | 1,574.5 | 1,604.0 | 1,579.8 | 1,636.1 | 1,575.5 | 1,605.5 | 1,526.6 | 1,552.7 |
| 2003 | 1,452.5 | 1,432.5 | 1,348.1 | 1,378.6 | 1,527.2 | 1,525.4 | 1,530.5 | 1,477.9 | 1,492.3 | 1,465.9 | 1,328.2 | 1,337.5 |
| 2004 | 1,113.6 | 1,206.3 | 1,256.3 | 1,231.0 | 1,183.4 | 1,259.1 | 1,301.1 | 1,253.8 | 1,250.0 | 1,221.8 | 1,167.3 | 1,209.1 |
| 2005 | 1,120.6 | 1,174.3 | 1,168.8 | 1,169.3 | 1,200.7 | 1,245.3 | 1,212.6 | 1,239.7 | 1,173.2 | 1,172.9 | 1,273.0 | 1,236.5 |
| 2006 | 1,139.7 | 1,207.1 | 1,199.0 | 1,196.2 | 1,211.9 | 1,285.9 | 1,278.1 | 1,279.6 | 1,237.0 | 1,241.2 | 1,143.3 | 1,164.4 |
| 2007 | 1,069.2 | 1,132.4 | 1,134.3 | 1,116.9 | 1,128.8 | 1,177.4 | 1,203.3 | 1,208.3 | 1,137.6 | 1,139.8 | 1,060.8 | 1,001.0 |
| 2008 | 960.1 | 1,002.6 | 991.8 | 1,029.3 | 1,012.6 | 1,005.3 | 1,013.4 | 1,005.0 | 976.0 | 931.1 | 957.5 | 852.4 |
| 2009 | 897.4 | 730.6 | 737.6 | 713.9 | 711.1 | 700.9 | 721.5 | 685.4 | 608.5 | 597.9 | 476.4 | 501.3 |
| 2010 | 282.7 | 395.2 | 339.5 | 332.0 | 326.6 | 340.5 | 346.2 | 345.5 | 340.6 | 332.7 | 310.6 | 325.4 |
| 2011 | 307.6 | 317.3 | 317.3 | 321.2 | 295.9 | 296.8 | 276.6 | 261.1 | 251.9 | 248.9 | 246.0 | 252.2 |
| 2012 | 245.7 | 304.3 | 299.3 | 313.9 | 325.7 | 326.3 | 337.4 | 349.8 | 333.3 | 332.8 | 335.9 | 327.4 |
| 2013 | 314.5 | 328.1 | 337.0 | 338.6 | 340.7 | 337.8 | 350.7 | 357.6 | 298.8 | 306.6 | 283.1 | 281.1 |
| 2014 | 349.7 | 356.9 | 374.3 | 383.3 | 383.8 | 395.4 | 397.2 | 405.7 | 398.5 | 344.5 | 380.8 | 347.4 |
| 2015 | 353.5 | 380.0 | 361.0 | 380.7 | 396.4 | 405.5 | 397.9 | 391.3 | 365.3 | 321.5 | 327.3 | 313.2 |
| 2016 | 299.9 | 330.8 | 327.9 | 345.4 | 341.6 | 356.3 | 347.9 | 360.8 | 345.7 | 323.2 | 315.9 | 347.1 |
| 2017 | 345.5 | 361.2 | 374.9 | 371.9 | 393.0 | 408.3 | 402.0 | 395.6 | 368.0 | 429.9 | 403.3 | 406.2 |
| 2018 | 398.1 | 403.5 | 400.2 | 366.8 | 416.3 | 417.7 | 416.2 | 433.8 | 429.4 | 415.2 | 411.4 | 420.7 |
| 2019 | 413.4 | 394.1 | 436.9 | 430.4 | 446.7 | 448.6 | 458.1 | 460.7 | 446.4 | 441.5 | 423.8 | 425.5 |
| 2020 | 414.5 | 426.5 | 344.2 | 254.6 | 300.9 | 345.4 | 353.2 | 348.3 | 340.5 | 340.0 | 308.8 | NA |
| 2021 | 284.3 | 250.3 | 327.1 | 328.3 | 278.9 | 262.1 | 270.7 | NA | NA | NA | 246.0 | 237.2 |
| 2022 | NA | 259.8 | 256.9 | |||||||||
| - = No Data Reported; -- = Not Applicable; NA = Not Available; W = Withheld to avoid disclosure of individual company data. |
| Release Date: 6/1/2022 |
| Next Release Date: TBD |