|
Download Data (XLS File) |
|
||||||||
|
||||||||
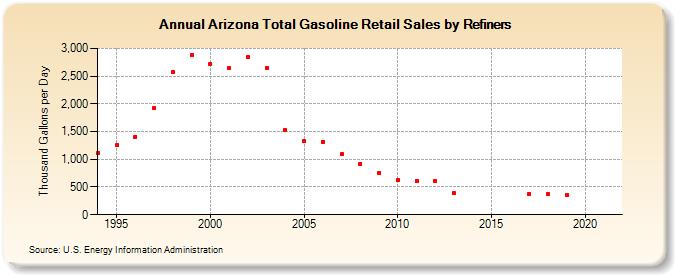
| Arizona Total Gasoline Retail Sales by Refiners (Thousand Gallons per Day) | ||||||||
| Decade | Year-0 | Year-1 | Year-2 | Year-3 | Year-4 | Year-5 | Year-6 | Year-7 | Year-8 | Year-9 |
|---|---|---|---|---|---|---|---|---|---|---|
| 1990's | 1,117.9 | 1,253.4 | 1,406.7 | 1,928.5 | 2,572.1 | 2,879.0 | ||||
| 2000's | 2,721.6 | 2,639.9 | 2,844.5 | 2,647.8 | 1,532.1 | 1,332.0 | 1,320.1 | 1,093.3 | 923.0 | 752.9 |
| 2010's | 628.7 | 610.8 | 607.9 | 391.2 | W | W | W | 377.7 | 377.9 | 362.5 |
| 2020's | W |
| - = No Data Reported; -- = Not Applicable; NA = Not Available; W = Withheld to avoid disclosure of individual company data. |
| Release Date: 6/1/2022 |
| Next Release Date: TBD |