|
Download Data (XLS File) |
|
||||||||
|
||||||||
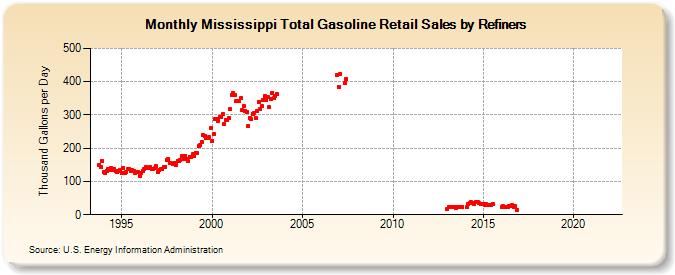
| Mississippi Total Gasoline Retail Sales by Refiners (Thousand Gallons per Day) | ||||||||
| Year | Jan | Feb | Mar | Apr | May | Jun | Jul | Aug | Sep | Oct | Nov | Dec |
|---|---|---|---|---|---|---|---|---|---|---|---|---|
| 1993 | 150.3 | 143.6 | 162.5 | |||||||||
| 1994 | 129.1 | 125.9 | 132.6 | 138.8 | 135.7 | 141.5 | 134.3 | 138.8 | 131.5 | 129.6 | 130.8 | 135.0 |
| 1995 | 123.9 | 140.7 | 125.8 | 127.7 | 136.4 | 138.7 | 131.2 | 133.9 | 130.0 | 126.0 | 128.2 | 128.3 |
| 1996 | 117.5 | 125.9 | 132.4 | 136.0 | 142.9 | 140.1 | 141.2 | 143.0 | 136.1 | 137.7 | 141.4 | 145.8 |
| 1997 | 127.3 | 134.0 | 138.1 | 137.3 | 142.8 | 144.3 | 165.2 | 166.3 | 154.1 | 154.5 | 153.4 | 156.6 |
| 1998 | 149.3 | 161.6 | 161.5 | 163.0 | 176.9 | 166.2 | 176.7 | 166.8 | 160.0 | 174.6 | 172.5 | 181.2 |
| 1999 | 176.5 | 186.9 | 185.0 | 206.1 | 210.7 | 219.2 | 239.4 | 237.8 | 230.8 | 231.6 | 233.6 | 260.2 |
| 2000 | 222.3 | 243.0 | 286.9 | 287.0 | 282.5 | 294.2 | 293.7 | 302.1 | 273.0 | 285.5 | 284.0 | 290.2 |
| 2001 | 316.6 | 360.6 | 366.0 | 359.7 | 341.3 | 342.8 | 341.0 | 349.9 | 313.6 | 326.9 | 312.5 | 308.8 |
| 2002 | 267.3 | 291.9 | 286.9 | 303.9 | 305.6 | 290.1 | 310.5 | 340.3 | 319.0 | 326.4 | 343.7 | 356.6 |
| 2003 | 343.7 | 352.5 | 322.5 | 347.5 | 366.1 | 350.4 | 357.4 | 361.6 | W | W | W | W |
| 2004 | W | W | W | W | W | W | W | W | W | W | W | W |
| 2005 | W | W | W | W | W | W | W | W | W | W | W | W |
| 2006 | W | W | W | W | W | W | W | W | W | W | W | 419.9 |
| 2007 | 384.8 | 423.8 | W | W | 395.4 | 408.6 | W | W | W | W | W | W |
| 2008 | W | W | W | W | W | W | W | W | W | W | W | W |
| 2009 | W | W | W | W | W | W | W | W | W | W | W | W |
| 2010 | W | W | W | W | W | W | W | W | W | W | W | W |
| 2011 | W | W | W | W | W | W | W | W | W | NA | W | W |
| 2012 | W | W | W | NA | W | NA | NA | NA | W | W | W | W |
| 2013 | 18.5 | 23.7 | 23.8 | 23.8 | 22.8 | 23.5 | 20.1 | 23.3 | 24.0 | W | 22.8 | W |
| 2014 | W | 22.0 | 32.6 | 35.6 | 36.9 | 35.7 | 33.4 | 38.1 | 36.8 | 34.6 | 31.9 | 30.9 |
| 2015 | 31.6 | 29.6 | 30.8 | 30.1 | 30.3 | 30.3 | 33.5 | W | W | W | W | W |
| 2016 | 23.8 | 25.4 | 23.1 | 23.8 | 23.4 | 25.1 | 27.0 | 29.0 | 23.2 | 26.0 | 15.1 | W |
| 2017 | W | - | - | - | - | - | - | - | - | - | - | - |
| 2018 | - | - | - | - | - | - | - | - | - | - | - | - |
| 2019 | - | - | - | - | - | - | - | - | - | - | - | - |
| 2020 | - | - | - | - | - | - | - | - | - | - | - | - |
| 2021 | - | - | - | - | - | - | - | - | - | - | - | - |
| 2022 | - | - | - | |||||||||
| - = No Data Reported; -- = Not Applicable; NA = Not Available; W = Withheld to avoid disclosure of individual company data. |
| Release Date: 6/1/2022 |
| Next Release Date: TBD |