|
Download Data (XLS File) |
|
||||||||
|
||||||||
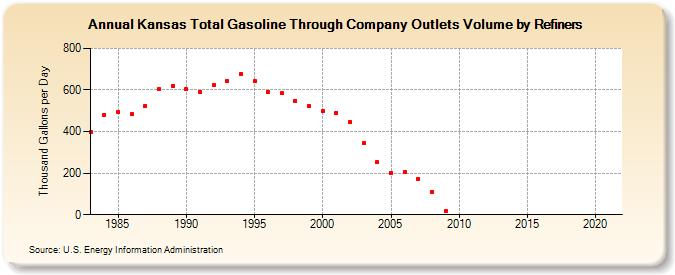
| Kansas Total Gasoline Through Company Outlets Volume by Refiners (Thousand Gallons per Day) | ||||||||
| Decade | Year-0 | Year-1 | Year-2 | Year-3 | Year-4 | Year-5 | Year-6 | Year-7 | Year-8 | Year-9 |
|---|---|---|---|---|---|---|---|---|---|---|
| 1980's | 396.4 | 479.8 | 493.2 | 483.0 | 524.8 | 602.8 | 618.0 | |||
| 1990's | 603.3 | 590.1 | 622.6 | 641.9 | 677.2 | 641.9 | 591.1 | 585.4 | 548.9 | 524.0 |
| 2000's | 498.2 | 491.0 | 446.0 | 345.0 | 251.9 | 199.2 | 204.6 | 173.7 | 111.2 | 16.7 |
| 2010's | W | W | W | W | W | W | W | W | W | W |
| 2020's | W |
| - = No Data Reported; -- = Not Applicable; NA = Not Available; W = Withheld to avoid disclosure of individual company data. |
| Release Date: 6/1/2022 |
| Next Release Date: TBD |