|
Download Data (XLS File) |
|
||||||||
|
||||||||
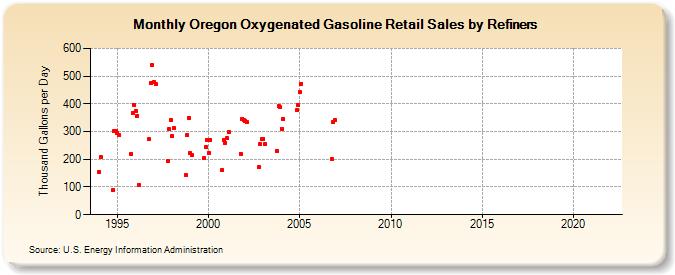
| Oregon Oxygenated Gasoline Retail Sales by Refiners (Thousand Gallons per Day) | ||||||||
| Year | Jan | Feb | Mar | Apr | May | Jun | Jul | Aug | Sep | Oct | Nov | Dec |
|---|---|---|---|---|---|---|---|---|---|---|---|---|
| 1994 | 155.2 | 208.7 | W | - | - | - | - | - | W | 89.5 | 300.2 | 301.3 |
| 1995 | 294.0 | 286.5 | W | W | W | W | W | W | W | 219.2 | 367.7 | 396.4 |
| 1996 | 373.1 | 357.8 | 107.7 | W | W | W | W | NA | NA | 272.8 | 474.4 | 538.8 |
| 1997 | 478.7 | 471.6 | W | W | W | W | W | W | W | 192.2 | 308.2 | 341.9 |
| 1998 | 283.7 | 312.8 | W | W | W | W | W | W | W | 143.2 | 285.8 | 349.1 |
| 1999 | 222.2 | 213.8 | W | W | W | W | W | W | W | 202.9 | 244.5 | 270.5 |
| 2000 | 224.2 | 270.4 | W | W | W | W | W | W | W | 161.6 | 270.3 | 259.1 |
| 2001 | 275.3 | 298.0 | W | W | W | W | W | W | W | 220.5 | 345.3 | 342.1 |
| 2002 | 339.2 | 333.4 | W | W | W | W | W | W | W | 171.1 | 255.0 | 273.2 |
| 2003 | 273.9 | 253.4 | W | W | W | W | W | W | W | 230.8 | 391.1 | 386.9 |
| 2004 | 310.4 | 345.0 | W | W | W | W | W | W | NA | W | 376.3 | 394.3 |
| 2005 | 440.9 | 473.0 | W | W | W | W | W | W | W | W | W | W |
| 2006 | W | W | W | W | W | W | W | NA | NA | 200.1 | 333.3 | 341.4 |
| 2007 | - | - | - | - | - | - | - | - | - | - | - | - |
| 2008 | - | - | - | - | - | - | - | - | - | - | - | - |
| 2009 | - | - | - | - | - | - | - | - | - | - | - | - |
| 2010 | - | - | - | - | - | - | - | - | - | - | - | - |
| 2011 | - | - | - | - | - | - | - | - | - | - | - | - |
| 2012 | - | - | - | - | - | - | - | - | - | - | - | - |
| 2013 | - | - | - | - | - | - | - | - | - | - | - | - |
| 2014 | - | - | - | - | - | - | - | - | - | - | - | - |
| 2015 | - | - | - | - | - | - | - | - | - | - | - | - |
| 2016 | - | - | - | - | - | - | - | - | - | - | - | - |
| 2017 | - | - | - | - | - | - | - | - | - | - | - | - |
| 2018 | - | - | - | - | - | - | - | - | - | - | - | - |
| 2019 | - | - | - | - | - | - | - | - | - | - | - | - |
| 2020 | - | - | - | - | - | - | - | - | - | - | - | - |
| 2021 | - | - | - | - | - | - | - | - | - | - | - | - |
| 2022 | - | - | - | |||||||||
| - = No Data Reported; -- = Not Applicable; NA = Not Available; W = Withheld to avoid disclosure of individual company data. |
| Release Date: 6/1/2022 |
| Next Release Date: TBD |