|
Download Data (XLS File) |
|
||||||||
|
||||||||
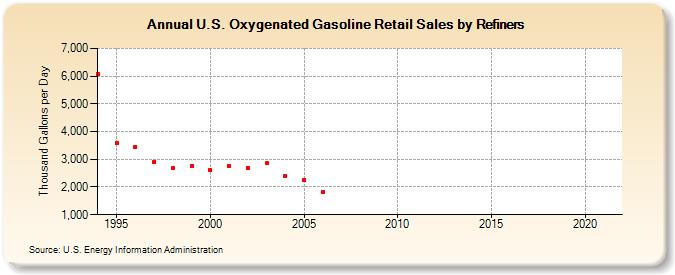
| U.S. Oxygenated Gasoline Retail Sales by Refiners (Thousand Gallons per Day) | ||||||||
| Decade | Year-0 | Year-1 | Year-2 | Year-3 | Year-4 | Year-5 | Year-6 | Year-7 | Year-8 | Year-9 |
|---|---|---|---|---|---|---|---|---|---|---|
| 1990's | 6,086.3 | 3,575.2 | 3,434.8 | 2,912.6 | 2,699.3 | 2,751.9 | ||||
| 2000's | 2,602.2 | 2,740.7 | 2,694.5 | 2,850.8 | 2,405.0 | 2,244.9 | 1,809.2 | - | - | - |
| 2010's | - | - | - | - | - | - | - | - | - | - |
| 2020's | - |
| - = No Data Reported; -- = Not Applicable; NA = Not Available; W = Withheld to avoid disclosure of individual company data. |
| Release Date: 6/1/2022 |
| Next Release Date: TBD |