|
Download Data (XLS File) |
|
||||||||
|
||||||||
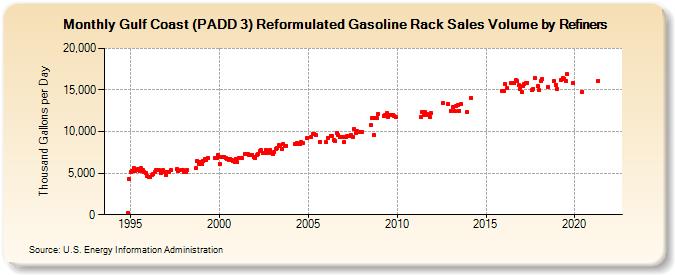
| Gulf Coast (PADD 3) Reformulated Gasoline Rack Sales Volume by Refiners (Thousand Gallons per Day) | ||||||||
| Year | Jan | Feb | Mar | Apr | May | Jun | Jul | Aug | Sep | Oct | Nov | Dec |
|---|---|---|---|---|---|---|---|---|---|---|---|---|
| 1994 | - | - | - | - | - | - | - | - | - | - | 161.8 | 4,246.3 |
| 1995 | 5,119.1 | 5,254.5 | 5,615.0 | 5,290.5 | 5,400.6 | 5,546.5 | 5,310.2 | 5,582.9 | 5,362.0 | 5,109.8 | 4,966.7 | 4,632.6 |
| 1996 | 4,527.0 | 4,511.3 | 4,781.8 | 4,860.2 | 5,132.1 | 5,390.3 | 5,352.1 | 5,322.2 | 4,966.4 | 5,132.1 | 5,319.6 | 5,177.1 |
| 1997 | 4,744.4 | 5,165.2 | 5,136.2 | 5,329.2 | W | W | W | 5,506.5 | 5,286.7 | W | 5,340.1 | 5,340.3 |
| 1998 | 5,108.9 | 5,192.5 | 5,393.0 | W | W | W | W | W | 5,604.3 | 6,407.7 | 6,084.5 | 6,289.3 |
| 1999 | 6,056.4 | 6,441.3 | 6,642.1 | 6,631.1 | 6,843.9 | W | W | W | W | 6,858.6 | 6,824.3 | 7,136.1 |
| 2000 | 6,110.8 | 6,953.1 | 6,963.0 | 6,980.5 | 6,779.2 | 6,682.4 | 6,620.1 | 6,702.1 | 6,523.9 | 6,459.3 | 6,368.3 | 6,641.1 |
| 2001 | 6,287.3 | 6,789.1 | 6,809.7 | 6,780.0 | W | 7,271.1 | 7,274.0 | 7,256.3 | 7,182.4 | 7,190.9 | 7,197.9 | 6,963.5 |
| 2002 | 6,850.1 | 7,132.6 | 7,278.3 | 7,623.0 | 7,725.1 | 7,443.1 | 7,452.5 | 7,806.9 | 7,455.2 | W | 7,760.4 | 7,384.8 |
| 2003 | 7,318.2 | 7,539.7 | 7,960.8 | 8,077.4 | 8,333.5 | 8,310.9 | 7,879.9 | 8,518.4 | 8,283.9 | 8,295.5 | W | W |
| 2004 | W | W | W | 8,527.1 | 8,568.7 | 8,476.7 | 8,467.8 | 8,701.2 | 8,676.9 | W | W | 9,210.9 |
| 2005 | W | W | 9,293.6 | 9,747.5 | 9,742.5 | 9,550.6 | W | W | 8,777.5 | W | W | W |
| 2006 | 8,708.7 | 9,247.0 | W | 9,479.2 | 9,501.1 | 8,944.6 | 8,892.2 | 9,862.3 | 9,621.9 | 9,350.6 | 9,375.8 | 9,353.9 |
| 2007 | 8,758.6 | 9,315.1 | 9,486.1 | W | 9,496.5 | 9,561.1 | 9,375.7 | 10,302.3 | 9,867.1 | 10,062.6 | W | 9,918.6 |
| 2008 | 9,980.2 | W | W | W | W | W | 10,799.2 | 11,617.8 | 9,577.6 | 11,603.2 | 11,599.1 | 12,151.9 |
| 2009 | W | W | W | 11,907.5 | 12,004.0 | 12,200.8 | 11,731.0 | 11,995.9 | 12,041.0 | 11,971.4 | 11,818.0 | 11,720.6 |
| 2010 | NA | NA | W | W | W | NA | NA | NA | NA | NA | NA | NA |
| 2011 | W | NA | W | W | 11,781.9 | 12,375.3 | 11,998.2 | 12,293.4 | 12,130.9 | 11,997.9 | 11,797.1 | 12,183.4 |
| 2012 | W | W | W | W | W | W | W | 13,445.1 | W | W | 13,301.5 | W |
| 2013 | 12,472.1 | W | 12,918.6 | 12,495.3 | 13,087.4 | 13,171.5 | 12,521.1 | 13,369.2 | W | W | W | 12,409.6 |
| 2014 | W | W | 14,092.7 | W | W | W | W | W | W | W | W | W |
| 2015 | W | W | W | W | W | W | W | W | W | W | W | 14,929.8 |
| 2016 | 14,828.5 | 15,683.9 | 15,212.2 | W | W | 15,856.9 | W | 15,811.5 | 16,191.0 | 16,091.7 | 15,567.0 | 15,117.3 |
| 2017 | 14,755.2 | 15,490.9 | 15,711.1 | 15,889.7 | 15,894.4 | W | W | 14,973.8 | 15,119.7 | 16,467.4 | W | 15,467.6 |
| 2018 | 14,964.5 | 16,074.3 | 16,345.3 | W | W | W | 15,385.0 | W | W | W | 16,065.9 | 15,644.1 |
| 2019 | 15,132.8 | W | W | 16,181.6 | 16,393.9 | 16,377.4 | 16,105.9 | 16,886.9 | W | W | W | 15,853.0 |
| 2020 | W | W | W | W | W | 14,804.5 | W | W | W | W | W | W |
| 2021 | W | W | W | W | 16,119.9 | W | W | W | W | W | W | W |
| 2022 | W | W | W | |||||||||
| - = No Data Reported; -- = Not Applicable; NA = Not Available; W = Withheld to avoid disclosure of individual company data. |
| Release Date: 6/1/2022 |
| Next Release Date: TBD |