|
Download Data (XLS File) |
|
||||||||
|
||||||||
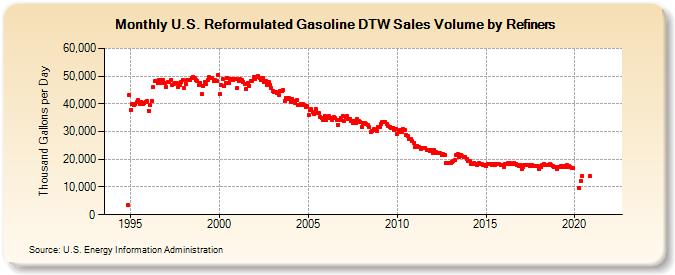
| U.S. Reformulated Gasoline DTW Sales Volume by Refiners (Thousand Gallons per Day) | ||||||||
| Year | Jan | Feb | Mar | Apr | May | Jun | Jul | Aug | Sep | Oct | Nov | Dec |
|---|---|---|---|---|---|---|---|---|---|---|---|---|
| 1994 | - | - | - | - | - | - | - | - | - | - | 3,541.7 | 43,147.7 |
| 1995 | 37,948.6 | 39,845.8 | 39,452.9 | 39,815.7 | 40,510.0 | 41,272.6 | 40,094.6 | 40,767.0 | 40,021.9 | 40,210.7 | 40,762.6 | 40,916.2 |
| 1996 | 37,520.8 | 39,481.6 | 40,953.0 | 45,980.5 | 48,136.2 | 48,380.7 | 47,375.7 | 48,577.1 | 47,464.3 | 48,489.4 | 48,517.4 | 47,640.8 |
| 1997 | 46,220.8 | 47,892.3 | 48,005.1 | 48,566.2 | 46,688.0 | 47,134.8 | 47,370.9 | 47,494.7 | 46,061.0 | 46,768.4 | 47,901.1 | 48,524.3 |
| 1998 | 45,582.8 | 47,279.4 | 48,469.9 | 48,547.0 | 48,573.3 | 49,441.3 | 49,731.9 | 49,405.8 | 48,563.4 | 48,219.1 | 46,774.4 | 47,655.6 |
| 1999 | 43,508.9 | 46,555.0 | 48,042.5 | 47,154.0 | 48,558.8 | 49,522.0 | 49,372.1 | 49,407.3 | 48,290.9 | 48,723.7 | 48,174.2 | 50,577.8 |
| 2000 | 43,498.8 | 46,891.3 | 48,781.9 | 46,373.3 | 47,590.1 | 49,474.0 | 47,335.0 | 48,907.5 | 49,135.3 | 48,737.7 | 48,844.6 | 49,037.8 |
| 2001 | 45,642.4 | 48,193.3 | 48,797.7 | 48,693.1 | 47,794.0 | 47,297.2 | 45,333.7 | 47,514.4 | 46,547.9 | 48,268.5 | 48,149.4 | 49,788.2 |
| 2002 | 49,057.6 | 49,771.9 | 49,999.0 | 49,178.5 | 48,702.0 | 49,339.7 | 47,799.5 | 48,082.3 | 46,708.5 | 47,787.8 | 46,712.3 | 45,775.8 |
| 2003 | 44,582.1 | 44,287.4 | 44,371.6 | 43,990.7 | 43,311.8 | 44,622.6 | 44,594.4 | 44,967.1 | 40,937.6 | 42,128.7 | 41,801.9 | 41,964.0 |
| 2004 | 40,828.3 | 41,736.2 | 41,173.4 | 40,400.2 | 41,313.1 | 39,568.6 | 39,564.8 | 39,903.0 | 40,064.8 | 39,556.5 | 38,730.9 | 39,085.9 |
| 2005 | 35,869.7 | 37,710.5 | 38,024.5 | 37,103.3 | 36,457.1 | 38,074.9 | 36,854.0 | 36,734.0 | 35,426.6 | 34,754.8 | 34,228.7 | 35,719.9 |
| 2006 | 34,344.2 | 34,734.0 | 35,449.7 | 34,909.0 | 34,204.3 | 35,203.3 | 34,781.0 | 34,119.8 | 32,359.0 | 34,312.6 | 35,046.3 | 35,687.5 |
| 2007 | 33,637.5 | 35,247.4 | 35,528.3 | 34,572.2 | 34,493.8 | 33,634.4 | 33,051.7 | 33,683.7 | 33,090.7 | 34,485.9 | 33,705.5 | 33,452.6 |
| 2008 | 31,797.4 | 33,108.3 | 33,158.1 | 32,827.2 | 32,227.7 | 31,686.3 | 29,979.8 | 30,085.5 | 30,863.7 | 30,711.5 | 30,351.6 | 31,545.6 |
| 2009 | 31,550.5 | 32,841.3 | 33,342.0 | 33,385.0 | 33,509.1 | 32,752.9 | 32,064.1 | 31,811.6 | 31,271.6 | 31,433.5 | 30,565.2 | 30,924.2 |
| 2010 | 28,974.8 | 29,844.6 | 30,593.3 | 30,004.3 | 30,944.7 | 30,455.5 | 28,898.1 | 28,307.8 | 27,448.0 | 27,214.8 | 26,510.5 | 25,938.2 |
| 2011 | 24,418.3 | 24,784.3 | 24,460.4 | 24,341.2 | 23,877.1 | 24,114.2 | 24,214.0 | 24,024.5 | 23,512.8 | 23,333.2 | 22,833.9 | 23,347.6 |
| 2012 | 22,331.7 | 23,335.8 | 22,786.9 | 22,420.2 | 22,179.9 | 22,178.6 | 21,700.2 | 21,943.9 | 21,566.4 | 18,736.0 | 18,499.4 | 18,737.5 |
| 2013 | 18,504.8 | 19,037.6 | 19,354.1 | 19,578.7 | 21,561.5 | 21,862.8 | 20,998.1 | 21,591.5 | 21,047.3 | 20,878.7 | 20,775.2 | 20,217.5 |
| 2014 | 19,210.0 | 19,338.5 | 18,351.8 | 18,193.7 | 18,604.1 | 18,386.0 | 17,823.7 | 18,511.1 | 18,193.3 | 18,419.6 | 18,101.3 | 18,061.9 |
| 2015 | 17,468.2 | 18,192.4 | 18,423.3 | 18,426.8 | 18,014.5 | 18,320.2 | 17,766.1 | 18,339.1 | 18,231.1 | 18,226.6 | 17,803.3 | 17,962.0 |
| 2016 | 17,295.3 | 18,395.9 | 18,390.2 | 18,584.8 | 18,492.9 | 18,354.8 | 18,204.6 | 18,684.5 | 18,318.5 | 18,020.4 | 17,719.3 | 18,004.0 |
| 2017 | 16,648.2 | 17,334.2 | 18,038.6 | 17,856.2 | 17,853.7 | 17,898.4 | 17,663.8 | 18,019.2 | 17,620.1 | 17,576.8 | 17,498.2 | 17,419.8 |
| 2018 | 16,383.7 | 17,382.6 | 17,790.1 | 18,191.2 | 17,926.7 | 17,931.0 | 17,775.2 | 18,249.8 | 17,836.8 | 17,611.8 | 17,306.4 | 17,292.6 |
| 2019 | 16,383.3 | 17,217.8 | 17,243.5 | 17,601.0 | 17,315.3 | 17,600.8 | 17,137.2 | 17,803.4 | 17,450.8 | 17,124.6 | 16,899.0 | 16,789.6 |
| 2020 | W | W | W | 9,487.9 | 12,336.5 | 14,006.9 | W | W | W | W | 13,840.3 | W |
| 2021 | W | W | W | W | W | W | W | W | W | W | W | W |
| 2022 | W | W | W | |||||||||
| - = No Data Reported; -- = Not Applicable; NA = Not Available; W = Withheld to avoid disclosure of individual company data. |
| Release Date: 6/1/2022 |
| Next Release Date: TBD |