|
Download Data (XLS File) |
|
||||||||
|
||||||||
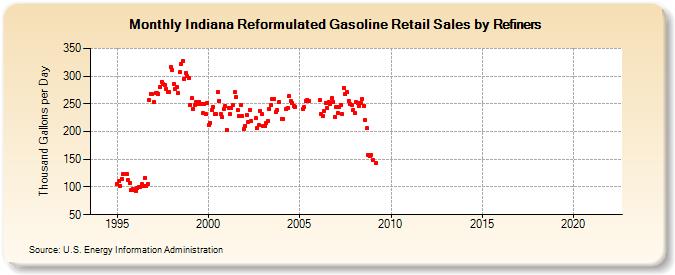
| Indiana Reformulated Gasoline Retail Sales by Refiners (Thousand Gallons per Day) | ||||||||
| Year | Jan | Feb | Mar | Apr | May | Jun | Jul | Aug | Sep | Oct | Nov | Dec |
|---|---|---|---|---|---|---|---|---|---|---|---|---|
| 1994 | - | - | - | - | - | - | - | - | - | - | - | W |
| 1995 | 105.6 | 110.2 | 101.8 | 115.0 | 124.3 | NA | 123.9 | 113.3 | 107.8 | 93.8 | 96.0 | 94.9 |
| 1996 | 93.4 | 97.8 | 100.4 | 100.5 | 104.5 | 101.4 | 116.5 | 101.8 | 105.4 | 257.4 | 268.3 | 266.9 |
| 1997 | 254.2 | 269.1 | 270.4 | 268.0 | 280.0 | 289.9 | 285.6 | 283.1 | 277.5 | 271.8 | 271.6 | 316.8 |
| 1998 | 310.6 | 285.5 | 277.2 | 280.0 | 269.9 | 306.9 | 321.7 | 327.1 | 294.3 | 306.0 | 299.3 | 296.5 |
| 1999 | 248.0 | 260.2 | 240.6 | 248.2 | 254.2 | 248.9 | 254.0 | 248.8 | 233.0 | 250.0 | 231.2 | 252.2 |
| 2000 | 211.5 | 216.2 | 238.7 | 244.3 | 230.8 | 231.3 | 271.0 | 256.0 | 231.4 | 225.4 | 241.3 | 245.2 |
| 2001 | 203.0 | 241.7 | 231.0 | 242.8 | 247.0 | 270.7 | 261.5 | 238.9 | 227.2 | 247.5 | 227.7 | 205.3 |
| 2002 | 210.9 | 230.3 | 217.5 | 239.5 | 219.8 | W | W | 224.8 | 207.1 | 211.3 | 237.6 | 231.1 |
| 2003 | 210.2 | 209.8 | 214.6 | 219.4 | 240.9 | 248.6 | 259.1 | 258.3 | 236.0 | 238.2 | 252.6 | W |
| 2004 | 223.1 | 223.3 | W | 240.2 | 243.1 | 263.7 | 255.3 | 251.4 | 246.8 | 244.7 | W | W |
| 2005 | W | W | 239.8 | 243.5 | 255.9 | 257.5 | 255.8 | W | W | W | W | W |
| 2006 | W | 256.1 | 231.7 | 227.5 | 237.5 | 252.4 | 242.8 | 252.6 | 250.1 | 259.8 | 253.5 | 226.8 |
| 2007 | 244.0 | 233.9 | 245.0 | 247.9 | 231.3 | 278.3 | 268.0 | 270.5 | 254.9 | 249.5 | 247.6 | 238.8 |
| 2008 | 233.5 | 252.6 | 252.4 | 246.4 | 252.0 | 259.1 | 245.5 | 220.5 | 205.8 | 158.6 | 155.2 | 158.6 |
| 2009 | 149.0 | W | 142.5 | W | W | W | W | W | W | W | W | W |
| 2010 | W | W | W | W | W | W | W | W | W | W | W | W |
| 2011 | W | W | W | W | W | W | W | W | W | W | W | W |
| 2012 | W | W | W | W | W | W | W | W | W | W | W | W |
| 2013 | W | W | W | W | W | W | W | W | W | W | W | W |
| 2014 | W | W | W | W | W | W | W | W | W | W | W | W |
| 2015 | W | W | W | W | W | W | W | W | W | W | W | W |
| 2016 | W | W | W | W | W | W | W | W | W | W | W | W |
| 2017 | W | W | W | W | W | W | W | W | W | W | W | W |
| 2018 | W | W | W | W | W | W | W | W | W | W | W | W |
| 2019 | W | W | W | W | W | W | W | W | W | W | W | W |
| 2020 | W | W | W | W | W | W | W | W | W | W | W | W |
| 2021 | W | W | W | W | W | W | W | W | W | W | W | W |
| 2022 | W | W | W | |||||||||
| - = No Data Reported; -- = Not Applicable; NA = Not Available; W = Withheld to avoid disclosure of individual company data. |
| Release Date: 6/1/2022 |
| Next Release Date: TBD |