|
Download Data (XLS File) |
|
||||||||
|
||||||||
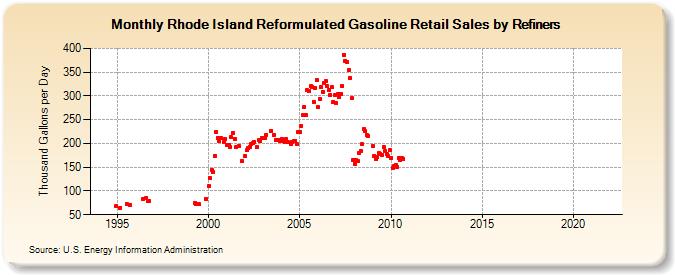
| Rhode Island Reformulated Gasoline Retail Sales by Refiners (Thousand Gallons per Day) | ||||||||
| Year | Jan | Feb | Mar | Apr | May | Jun | Jul | Aug | Sep | Oct | Nov | Dec |
|---|---|---|---|---|---|---|---|---|---|---|---|---|
| 1994 | - | - | - | - | - | - | - | - | - | - | W | 67.5 |
| 1995 | W | W | 64.7 | W | W | W | 73.0 | W | 70.6 | W | W | W |
| 1996 | W | W | W | W | W | 82.7 | W | 85.3 | 79.0 | 78.8 | W | W |
| 1997 | W | W | W | W | W | W | W | W | W | W | W | W |
| 1998 | W | W | W | W | W | W | W | W | W | W | W | W |
| 1999 | W | W | W | 75.1 | 73.1 | 72.9 | 71.6 | W | W | W | 84.0 | W |
| 2000 | 110.1 | 127.0 | 144.9 | 139.3 | 174.1 | 225.1 | 212.3 | 205.1 | 211.7 | W | 203.9 | 209.5 |
| 2001 | 196.5 | 196.3 | 192.5 | 213.0 | 222.4 | 210.2 | 191.6 | W | 193.7 | W | 162.9 | W |
| 2002 | 173.5 | 185.2 | 189.6 | 193.3 | 199.0 | 201.1 | 203.6 | W | 192.4 | 206.2 | 204.7 | 212.2 |
| 2003 | W | 211.1 | 218.4 | W | W | 227.2 | W | 218.6 | 207.0 | 207.5 | 207.2 | 206.1 |
| 2004 | 209.6 | 205.9 | 202.7 | 209.1 | 203.3 | W | 198.0 | 203.0 | 205.1 | 204.8 | 198.1 | 223.7 |
| 2005 | 224.2 | 236.8 | 260.3 | 276.2 | 259.4 | 312.2 | 309.9 | 320.1 | 319.4 | 288.0 | 317.4 | 333.7 |
| 2006 | 276.5 | 293.1 | 318.7 | 309.0 | 327.3 | 330.4 | 320.4 | 312.5 | 302.8 | 318.1 | 287.3 | 301.4 |
| 2007 | 284.5 | 303.7 | 298.5 | 304.2 | 320.9 | 387.0 | 374.3 | 371.8 | 353.5 | 338.5 | 295.1 | 164.8 |
| 2008 | 157.5 | 164.8 | 163.1 | 180.6 | 184.4 | 198.1 | 230.1 | 226.3 | 218.3 | 216.1 | W | W |
| 2009 | 194.0 | 174.2 | 167.7 | 171.1 | 179.0 | 178.5 | 176.4 | 193.0 | 183.7 | 177.5 | 173.5 | 185.6 |
| 2010 | 169.4 | 148.8 | 152.9 | 154.9 | 150.7 | 168.3 | 164.8 | 168.8 | 167.6 | W | W | W |
| 2011 | W | W | W | W | W | W | W | W | W | W | W | W |
| 2012 | W | W | W | W | W | W | W | W | W | W | W | W |
| 2013 | W | W | W | W | W | W | W | W | W | W | W | W |
| 2014 | W | W | W | W | W | W | - | W | W | W | W | W |
| 2015 | W | W | W | W | W | W | W | W | W | W | W | W |
| 2016 | W | W | W | W | W | W | W | W | W | W | W | W |
| 2017 | W | W | W | W | W | W | W | W | W | W | W | W |
| 2018 | W | W | W | W | W | W | W | W | W | W | W | W |
| 2019 | W | W | W | W | W | W | W | W | W | W | W | W |
| 2020 | W | W | W | W | W | W | W | W | W | W | W | W |
| 2021 | W | W | W | W | W | - | - | - | - | - | - | - |
| 2022 | - | - | - | |||||||||
| - = No Data Reported; -- = Not Applicable; NA = Not Available; W = Withheld to avoid disclosure of individual company data. |
| Release Date: 6/1/2022 |
| Next Release Date: TBD |