|
Download Data (XLS File) |
|
||||||||
|
||||||||
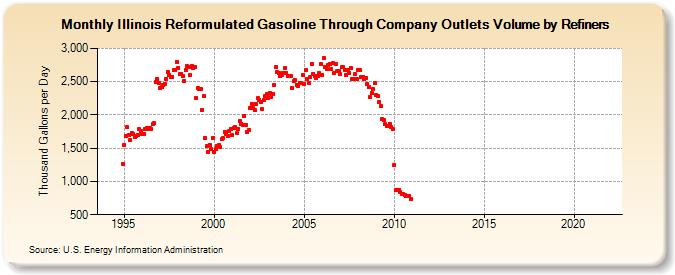
| Illinois Reformulated Gasoline Through Company Outlets Volume by Refiners (Thousand Gallons per Day) | ||||||||
| Year | Jan | Feb | Mar | Apr | May | Jun | Jul | Aug | Sep | Oct | Nov | Dec |
|---|---|---|---|---|---|---|---|---|---|---|---|---|
| 1994 | - | - | - | - | - | - | - | - | - | - | - | 1,265.3 |
| 1995 | 1,553.9 | 1,679.5 | 1,812.8 | 1,701.1 | 1,620.3 | 1,729.0 | 1,709.8 | 1,668.7 | 1,679.3 | 1,695.9 | 1,786.1 | 1,756.5 |
| 1996 | 1,712.0 | 1,716.1 | 1,783.9 | 1,800.9 | 1,788.5 | 1,808.2 | 1,785.4 | 1,862.6 | 1,872.4 | 2,499.5 | 2,547.0 | 2,485.6 |
| 1997 | 2,408.0 | 2,422.5 | 2,442.5 | 2,468.3 | 2,545.2 | 2,648.8 | 2,595.5 | 2,574.3 | 2,570.2 | 2,669.0 | 2,667.9 | 2,798.9 |
| 1998 | 2,710.7 | 2,608.9 | 2,620.6 | 2,580.1 | 2,516.2 | 2,674.2 | 2,728.9 | 2,715.2 | 2,600.2 | 2,731.9 | 2,710.0 | 2,721.4 |
| 1999 | 2,257.0 | 2,399.6 | 2,391.9 | 2,397.1 | 2,074.3 | 2,277.0 | 1,654.4 | 1,525.6 | 1,449.6 | 1,545.3 | 1,481.5 | 1,655.3 |
| 2000 | 1,442.5 | 1,489.9 | 1,532.8 | 1,543.8 | 1,511.1 | 1,633.5 | 1,649.8 | 1,743.6 | 1,707.7 | 1,681.9 | 1,751.7 | 1,793.0 |
| 2001 | 1,690.7 | 1,810.6 | 1,812.6 | 1,722.8 | 1,794.4 | 1,910.5 | 1,869.0 | 1,842.3 | 1,986.6 | 1,855.3 | 1,748.7 | 1,771.8 |
| 2002 | 2,101.0 | 2,169.7 | 2,097.7 | 2,067.6 | 2,158.9 | 2,247.2 | 2,227.8 | 2,197.2 | 2,092.1 | 2,221.3 | 2,280.8 | 2,314.1 |
| 2003 | 2,254.7 | 2,329.8 | 2,266.4 | 2,321.7 | 2,455.4 | 2,714.4 | 2,637.9 | 2,632.2 | 2,589.9 | 2,597.4 | 2,634.4 | 2,704.4 |
| 2004 | 2,627.8 | 2,580.6 | 2,589.3 | 2,587.3 | 2,404.6 | 2,503.2 | 2,526.6 | 2,456.1 | 2,440.8 | 2,473.8 | 2,477.1 | 2,593.8 |
| 2005 | 2,464.3 | 2,670.0 | 2,534.7 | 2,484.9 | 2,564.0 | 2,771.8 | 2,619.5 | 2,585.5 | 2,547.7 | 2,581.7 | 2,627.2 | 2,764.6 |
| 2006 | 2,603.6 | 2,856.8 | 2,715.3 | 2,695.2 | 2,743.2 | 2,762.1 | 2,683.9 | 2,776.7 | 2,630.5 | 2,762.9 | 2,658.5 | 2,666.1 |
| 2007 | 2,614.2 | 2,713.2 | 2,720.0 | 2,670.4 | 2,600.6 | 2,668.0 | 2,626.8 | 2,710.5 | 2,544.3 | 2,538.9 | 2,609.6 | 2,540.5 |
| 2008 | 2,680.4 | 2,677.6 | 2,563.0 | 2,568.2 | 2,541.7 | 2,549.1 | 2,467.2 | 2,413.7 | 2,263.7 | 2,328.0 | 2,388.8 | 2,478.8 |
| 2009 | 2,299.2 | 2,278.1 | 2,200.4 | 2,128.9 | 1,931.5 | 1,921.9 | 1,857.3 | 1,839.1 | 1,830.7 | 1,868.3 | 1,812.9 | 1,793.1 |
| 2010 | 1,240.8 | 877.4 | 875.0 | 877.7 | 840.9 | 818.8 | 809.0 | 803.7 | 784.8 | 784.0 | 781.8 | 738.4 |
| 2011 | W | W | W | W | W | W | W | W | W | W | W | W |
| 2012 | W | W | W | W | W | W | W | W | W | W | W | W |
| 2013 | W | W | W | W | W | W | W | W | W | W | W | W |
| 2014 | W | W | W | W | W | W | W | W | W | W | W | W |
| 2015 | W | W | W | W | W | W | W | W | NA | NA | NA | W |
| 2016 | W | W | W | W | W | W | W | W | W | W | W | W |
| 2017 | W | W | W | W | W | W | W | W | W | W | W | W |
| 2018 | W | W | W | W | W | W | W | W | W | W | W | W |
| 2019 | W | W | W | W | W | W | W | W | W | W | W | W |
| 2020 | W | W | W | W | W | W | W | W | W | W | W | W |
| 2021 | W | W | W | W | W | - | - | - | - | - | - | - |
| 2022 | W | W | W | |||||||||
| - = No Data Reported; -- = Not Applicable; NA = Not Available; W = Withheld to avoid disclosure of individual company data. |
| Release Date: 6/1/2022 |
| Next Release Date: TBD |