|
Download Data (XLS File) |
|
|||||
|
|||||
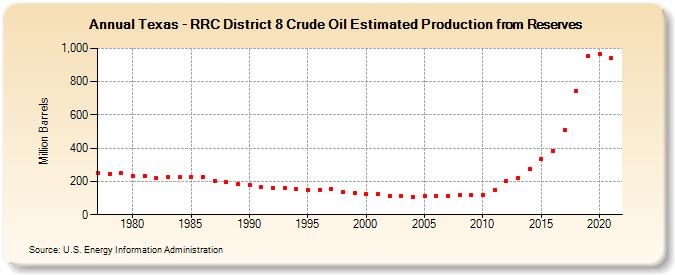
| Texas - RRC District 8 Crude Oil Estimated Production from Reserves (Million Barrels) | |||||
| Decade | Year-0 | Year-1 | Year-2 | Year-3 | Year-4 | Year-5 | Year-6 | Year-7 | Year-8 | Year-9 |
|---|---|---|---|---|---|---|---|---|---|---|
| 1970's | 251 | 246 | 252 | |||||||
| 1980's | 235 | 235 | 219 | 226 | 225 | 229 | 224 | 203 | 198 | 185 |
| 1990's | 176 | 165 | 161 | 161 | 157 | 151 | 149 | 157 | 138 | 132 |
| 2000's | 126 | 123 | 113 | 111 | 109 | 110 | 111 | 113 | 118 | 118 |
| 2010's | 120 | 151 | 200 | 221 | 274 | 334 | 382 | 508 | 745 | 952 |
| 2020's | 968 | 945 |
| - = No Data Reported; -- = Not Applicable; NA = Not Available; W = Withheld to avoid disclosure of individual company data. |
| Release Date: 12/30/2022 |
| Next Release Date: 12/29/2023 |