|
Download Data (XLS File) |
|
||||||||
|
||||||||
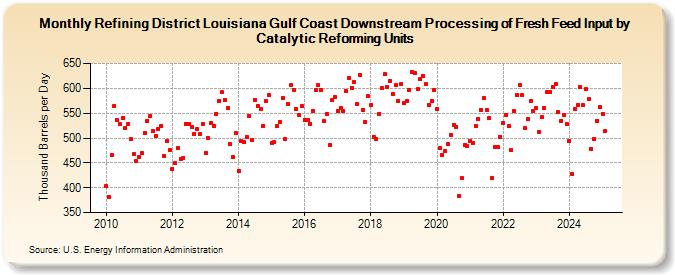
| Refining District Louisiana Gulf Coast Downstream Processing of Fresh Feed Input by Catalytic Reforming Units (Thousand Barrels per Day) | ||||||||
| Year | Jan | Feb | Mar | Apr | May | Jun | Jul | Aug | Sep | Oct | Nov | Dec |
|---|---|---|---|---|---|---|---|---|---|---|---|---|
| 2010 | 403 | 381 | 466 | 565 | 536 | 528 | 540 | 521 | 529 | 498 | 468 | 453 |
| 2011 | 461 | 469 | 510 | 535 | 545 | 514 | 504 | 518 | 525 | 464 | 494 | 476 |
| 2012 | 438 | 449 | 479 | 458 | 460 | 529 | 529 | 523 | 509 | 518 | 509 | 528 |
| 2013 | 470 | 500 | 530 | 524 | 549 | 575 | 592 | 577 | 560 | 487 | 461 | 510 |
| 2014 | 434 | 493 | 492 | 503 | 545 | 496 | 577 | 565 | 559 | 525 | 575 | 586 |
| 2015 | 489 | 491 | 524 | 533 | 581 | 498 | 568 | 606 | 597 | 559 | 546 | 564 |
| 2016 | 536 | 537 | 529 | 554 | 597 | 606 | 596 | 534 | 548 | 486 | 576 | 583 |
| 2017 | 554 | 560 | 554 | 595 | 620 | 601 | 612 | 568 | 627 | 556 | 533 | 584 |
| 2018 | 566 | 503 | 499 | 549 | 600 | 628 | 603 | 615 | 589 | 606 | 574 | 608 |
| 2019 | 570 | 574 | 597 | 633 | 630 | 598 | 618 | 625 | 608 | 567 | 575 | 596 |
| 2020 | 558 | 480 | 466 | 473 | 487 | 506 | 527 | 523 | 384 | 419 | 486 | 483 |
| 2021 | 495 | 489 | 525 | 539 | 557 | 580 | 556 | 540 | 419 | 482 | 482 | 502 |
| 2022 | 531 | 547 | 524 | 476 | 554 | 587 | 607 | 586 | 520 | 538 | 575 | 554 |
| 2023 | 560 | 522 | 542 | 560 | 592 | 592 | 603 | 609 | 552 | 534 | 547 | 529 |
| 2024 | 494 | |||||||||||
| - = No Data Reported; -- = Not Applicable; NA = Not Available; W = Withheld to avoid disclosure of individual company data. |
| Release Date: 3/29/2024 |
| Next Release Date: 4/30/2024 |