|
Download Data (XLS File) |
|
||||||||
|
||||||||
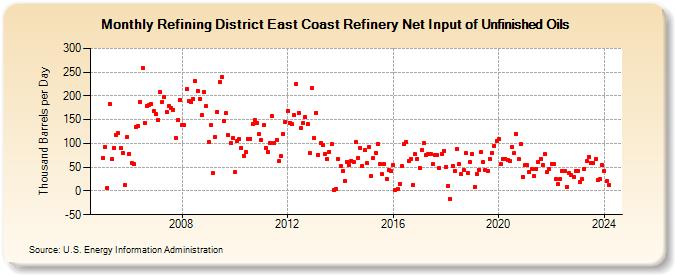
| Refining District East Coast Refinery Net Input of Unfinished Oils (Thousand Barrels per Day) | ||||||||
| Year | Jan | Feb | Mar | Apr | May | Jun | Jul | Aug | Sep | Oct | Nov | Dec |
|---|---|---|---|---|---|---|---|---|---|---|---|---|
| 2005 | 70 | 92 | 7 | 184 | 67 | 91 | 117 | 121 | 90 | 80 | 12 | 114 |
| 2006 | 78 | 58 | 57 | 135 | 137 | 188 | 259 | 144 | 179 | 181 | 183 | 168 |
| 2007 | 161 | 149 | 209 | 188 | 197 | 167 | 178 | 175 | 171 | 112 | 149 | 192 |
| 2008 | 139 | 138 | 214 | 189 | 187 | 194 | 231 | 211 | 193 | 160 | 208 | 178 |
| 2009 | 103 | 138 | 37 | 114 | 167 | 229 | 240 | 147 | 163 | 117 | 100 | 111 |
| 2010 | 39 | 106 | 109 | 91 | 74 | 82 | 109 | 110 | 141 | 150 | 142 | 119 |
| 2011 | 108 | 138 | 91 | 82 | 101 | 157 | 100 | 108 | 62 | 73 | 120 | 146 |
| 2012 | 169 | 144 | 140 | 159 | 225 | 165 | 133 | 143 | 155 | 140 | 80 | 217 |
| 2013 | 112 | 165 | 76 | 100 | 97 | 78 | 67 | 83 | 98 | 3 | 5 | 67 |
| 2014 | 53 | 41 | 20 | 61 | 54 | 64 | 60 | 104 | 70 | 91 | 52 | 86 |
| 2015 | 58 | 93 | 31 | 70 | 80 | 99 | 56 | 35 | 56 | 26 | 44 | 42 |
| 2016 | 54 | 2 | 4 | 15 | 52 | 99 | 103 | 64 | 68 | 13 | 77 | 68 |
| 2017 | 49 | 87 | 100 | 75 | 78 | 78 | 56 | 75 | 75 | 49 | 78 | 85 |
| 2018 | 51 | 11 | -16 | 53 | 41 | 88 | 56 | 35 | 44 | 79 | 38 | 60 |
| 2019 | 78 | 9 | 35 | 45 | 81 | 60 | 44 | 43 | 68 | 80 | 95 | 106 |
| 2020 | 109 | 56 | 68 | 68 | 65 | 63 | 92 | 79 | 120 | 67 | 99 | 30 |
| 2021 | 54 | 54 | 39 | 46 | 31 | 47 | 60 | 67 | 55 | 77 | 39 | 47 |
| 2022 | 57 | 56 | 25 | 14 | 25 | 42 | 42 | 9 | 37 | 34 | 30 | 43 |
| 2023 | 42 | 19 | 25 | 47 | 63 | 72 | 58 | 59 | 67 | 22 | 25 | 54 |
| 2024 | 41 | 20 | ||||||||||
| - = No Data Reported; -- = Not Applicable; NA = Not Available; W = Withheld to avoid disclosure of individual company data. |
| Release Date: 4/30/2024 |
| Next Release Date: 5/31/2024 |
Referring Pages: