|
Download Data (XLS File) |
|
||||||||
|
||||||||
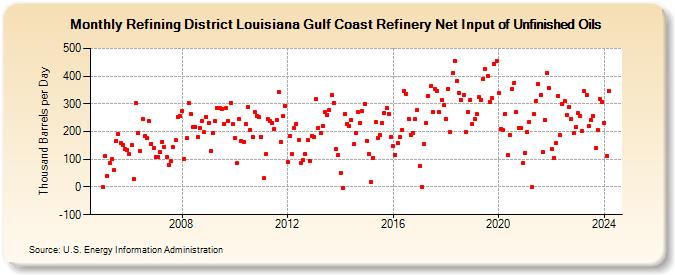
| Refining District Louisiana Gulf Coast Refinery Net Input of Unfinished Oils (Thousand Barrels per Day) | ||||||||
| Year | Jan | Feb | Mar | Apr | May | Jun | Jul | Aug | Sep | Oct | Nov | Dec |
|---|---|---|---|---|---|---|---|---|---|---|---|---|
| 2005 | -1 | 111 | 39 | 86 | 100 | 62 | 166 | 190 | 160 | 153 | 136 | 135 |
| 2006 | 118 | 152 | 29 | 302 | 193 | 129 | 245 | 183 | 176 | 237 | 156 | 140 |
| 2007 | 107 | 108 | 126 | 164 | 145 | 108 | 79 | 92 | 144 | 168 | 251 | 256 |
| 2008 | 274 | 102 | 175 | 304 | 263 | 217 | 217 | 180 | 213 | 238 | 197 | 254 |
| 2009 | 230 | 131 | 194 | 238 | 284 | 285 | 283 | 227 | 285 | 239 | 303 | 226 |
| 2010 | 178 | 85 | 245 | 165 | 163 | 228 | 288 | 206 | 180 | 270 | 257 | 251 |
| 2011 | 180 | 31 | 119 | 244 | 237 | 232 | 210 | 242 | 342 | 163 | 256 | 291 |
| 2012 | 90 | 184 | 118 | 212 | 227 | 170 | 87 | 98 | 119 | 170 | 95 | 184 |
| 2013 | 179 | 317 | 213 | 196 | 221 | 272 | 261 | 276 | 331 | 302 | 138 | 116 |
| 2014 | 51 | -2 | 265 | 228 | 220 | 241 | 154 | 194 | 270 | 230 | 273 | 301 |
| 2015 | 166 | 120 | 17 | 104 | 233 | 177 | 189 | 230 | 268 | 286 | 265 | 182 |
| 2016 | 147 | 116 | 160 | 179 | 206 | 346 | 337 | 247 | 189 | 196 | 245 | 277 |
| 2017 | 77 | 1 | 155 | 230 | 330 | 363 | 271 | 353 | 346 | 270 | 315 | 295 |
| 2018 | 245 | 355 | 197 | 410 | 455 | 381 | 340 | 313 | 333 | 199 | 272 | 314 |
| 2019 | 227 | 246 | 263 | 324 | 315 | 390 | 427 | 400 | 308 | 321 | 444 | 455 |
| 2020 | 338 | 209 | 205 | 264 | 115 | 189 | 355 | 376 | 269 | 212 | 213 | 87 |
| 2021 | 123 | 199 | 235 | -1 | 264 | 312 | 371 | 331 | 125 | 241 | 410 | 356 |
| 2022 | 137 | 106 | 157 | 330 | 186 | 300 | 310 | 261 | 290 | 245 | 193 | 217 |
| 2023 | 266 | 257 | 203 | 345 | 331 | 220 | 240 | 255 | 141 | 204 | 318 | 308 |
| 2024 | 232 | 112 | ||||||||||
| - = No Data Reported; -- = Not Applicable; NA = Not Available; W = Withheld to avoid disclosure of individual company data. |
| Release Date: 4/30/2024 |
| Next Release Date: 5/31/2024 |