|
Download Data (XLS File) |
|
||||||||
|
||||||||
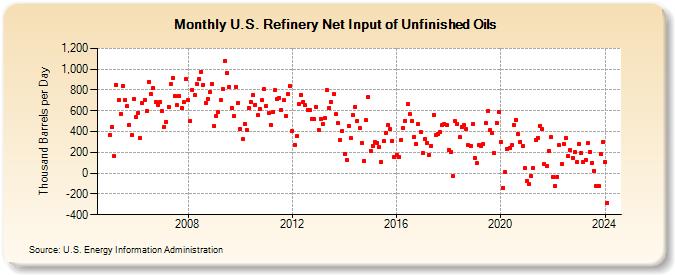
| U.S. Refinery Net Input of Unfinished Oils (Thousand Barrels per Day) | ||||||||
| Year | Jan | Feb | Mar | Apr | May | Jun | Jul | Aug | Sep | Oct | Nov | Dec |
|---|---|---|---|---|---|---|---|---|---|---|---|---|
| 2005 | 368 | 442 | 163 | 852 | 700 | 571 | 840 | 701 | 641 | 465 | 364 | 715 |
| 2006 | 536 | 581 | 341 | 677 | 706 | 601 | 880 | 761 | 819 | 686 | 659 | 686 |
| 2007 | 600 | 448 | 495 | 640 | 853 | 919 | 744 | 654 | 744 | 624 | 680 | 903 |
| 2008 | 704 | 501 | 798 | 749 | 856 | 910 | 976 | 850 | 675 | 714 | 777 | 857 |
| 2009 | 454 | 551 | 585 | 701 | 812 | 1,083 | 961 | 832 | 629 | 548 | 831 | 676 |
| 2010 | 426 | 325 | 477 | 417 | 625 | 685 | 752 | 658 | 559 | 615 | 703 | 805 |
| 2011 | 646 | 575 | 463 | 585 | 796 | 712 | 727 | 611 | 700 | 545 | 759 | 835 |
| 2012 | 404 | 275 | 354 | 666 | 756 | 688 | 653 | 612 | 607 | 521 | 516 | 639 |
| 2013 | 417 | 525 | 477 | 533 | 797 | 631 | 682 | 763 | 565 | 481 | 320 | 401 |
| 2014 | 184 | 130 | 454 | 334 | 557 | 637 | 504 | 430 | 291 | 120 | 510 | 731 |
| 2015 | 214 | 265 | 299 | 294 | 250 | 106 | 306 | 388 | 463 | 422 | 306 | 155 |
| 2016 | 177 | 154 | 320 | 438 | 506 | 662 | 565 | 505 | 351 | 283 | 474 | 396 |
| 2017 | 193 | 330 | 290 | 178 | 262 | 564 | 368 | 376 | 391 | 461 | 474 | 466 |
| 2018 | 223 | 199 | -32 | 498 | 474 | 345 | 443 | 459 | 423 | 270 | 259 | 475 |
| 2019 | 150 | 94 | 273 | 262 | 282 | 480 | 598 | 412 | 382 | 192 | 484 | 586 |
| 2020 | 298 | -140 | 11 | 228 | 240 | 267 | 461 | 514 | 372 | 302 | 260 | 46 |
| 2021 | -71 | -106 | -29 | 50 | 317 | 339 | 456 | 424 | 85 | 69 | 212 | 347 |
| 2022 | -36 | -125 | -36 | 268 | 91 | 279 | 338 | 165 | 222 | 150 | 200 | 107 |
| 2023 | 282 | 197 | 106 | 127 | 286 | 206 | 100 | 24 | -120 | -119 | 186 | 299 |
| 2024 | 111 | |||||||||||
| - = No Data Reported; -- = Not Applicable; NA = Not Available; W = Withheld to avoid disclosure of individual company data. |
| Release Date: 3/29/2024 |
| Next Release Date: 4/30/2024 |
Referring Pages: