|
Download Data (XLS File) |
|
||||||||
|
||||||||
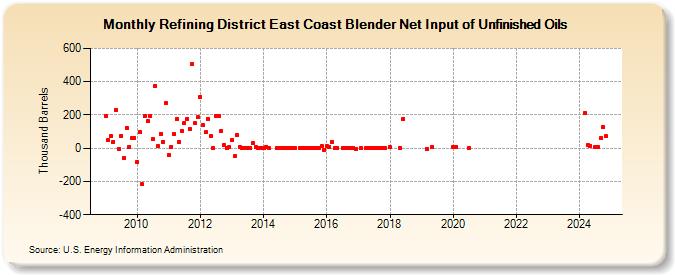
| Refining District East Coast Blender Net Input of Unfinished Oils (Thousand Barrels) | ||||||||
| Year | Jan | Feb | Mar | Apr | May | Jun | Jul | Aug | Sep | Oct | Nov | Dec |
|---|---|---|---|---|---|---|---|---|---|---|---|---|
| 2009 | 192 | 47 | 72 | 40 | 231 | -2 | 74 | -60 | 124 | 10 | 60 | 64 |
| 2010 | -82 | 95 | -218 | 194 | 161 | 193 | 53 | 373 | 13 | 88 | 36 | 270 |
| 2011 | -43 | 8 | 87 | 174 | 37 | 105 | 152 | 176 | 118 | 505 | 149 | 185 |
| 2012 | 309 | 139 | 95 | 178 | 73 | 1 | 196 | 193 | 104 | 20 | 3 | 8 |
| 2013 | 48 | -49 | 79 | 6 | 1 | 1 | 1 | 1 | 29 | 6 | 1 | 1 |
| 2014 | 1 | 10 | 1 | 1 | 3 | 1 | 1 | 1 | 1 | 1 | ||
| 2015 | 1 | 1 | 1 | 2 | 1 | 1 | 1 | 1 | 1 | 12 | -8 | |
| 2016 | 12 | 10 | 38 | 1 | 1 | 2 | 3 | 1 | 2 | 1 | -6 | |
| 2017 | 2 | 1 | 1 | 1 | 2 | 2 | 1 | 1 | 1 | |||
| 2018 | 5 | 2 | 174 | |||||||||
| 2019 | -5 | 7 | ||||||||||
| 2020 | 5 | 8 | 1 | |||||||||
| - = No Data Reported; -- = Not Applicable; NA = Not Available; W = Withheld to avoid disclosure of individual company data. |
| Release Date: 3/29/2024 |
| Next Release Date: 4/30/2024 |
Referring Pages: