|
Download Data (XLS File) |
|
||||||||
|
||||||||
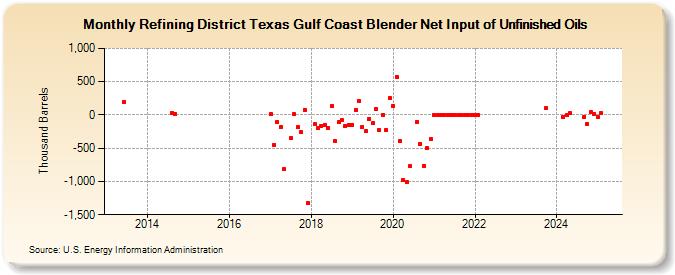
| Refining District Texas Gulf Coast Blender Net Input of Unfinished Oils (Thousand Barrels) | ||||||||
| Year | Jan | Feb | Mar | Apr | May | Jun | Jul | Aug | Sep | Oct | Nov | Dec |
|---|---|---|---|---|---|---|---|---|---|---|---|---|
| 2013 | 200 | |||||||||||
| 2014 | 35 | 17 | ||||||||||
| 2017 | 11 | -447 | -104 | -186 | -818 | -353 | 7 | -184 | -253 | 79 | -1,321 | |
| 2018 | -143 | -204 | -163 | -148 | -197 | 133 | -396 | -112 | -75 | -170 | -146 | |
| 2019 | -144 | 75 | 209 | -182 | -245 | -59 | -128 | 93 | -228 | 3 | -225 | 258 |
| 2020 | 140 | 568 | -394 | -975 | -1,012 | -775 | -105 | -431 | -763 | -498 | -364 | |
| 2021 | 0 | 0 | 0 | 0 | 0 | 0 | 0 | 0 | 0 | 0 | 0 | 0 |
| 2022 | 0 | 0 | ||||||||||
| 2023 | 97 | |||||||||||
| - = No Data Reported; -- = Not Applicable; NA = Not Available; W = Withheld to avoid disclosure of individual company data. |
| Release Date: 3/29/2024 |
| Next Release Date: 4/30/2024 |