|
Download Data (XLS File) |
|
||||||||
|
||||||||
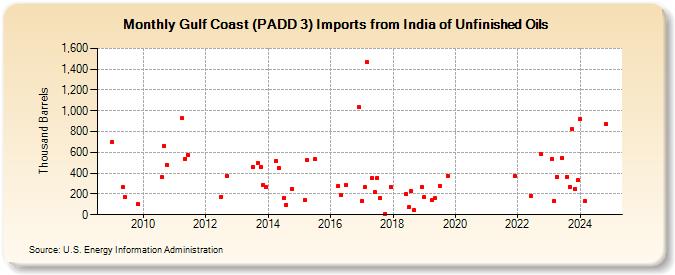
| Gulf Coast (PADD 3) Imports from India of Unfinished Oils (Thousand Barrels) | ||||||||
| Year | Jan | Feb | Mar | Apr | May | Jun | Jul | Aug | Sep | Oct | Nov | Dec |
|---|---|---|---|---|---|---|---|---|---|---|---|---|
| 2009 | 700 | 265 | 167 | 100 | ||||||||
| 2010 | 358 | 662 | 480 | |||||||||
| 2011 | 927 | 540 | 575 | |||||||||
| 2012 | 174 | 373 | ||||||||||
| 2013 | 458 | 496 | 458 | 290 | 263 | |||||||
| 2014 | 520 | 452 | 164 | 94 | 250 | |||||||
| 2015 | 143 | 531 | 533 | |||||||||
| 2016 | 280 | 185 | 288 | 1,033 | ||||||||
| 2017 | 132 | 265 | 1,467 | 354 | 214 | 352 | 164 | 10 | 270 | |||
| 2018 | 198 | 70 | 224 | 42 | 268 | |||||||
| 2019 | 167 | 141 | 158 | 279 | 376 | |||||||
| 2021 | 369 | |||||||||||
| 2022 | 183 | 581 | ||||||||||
| 2023 | 538 | 132 | 365 | 550 | 364 | 268 | 824 | 249 | 331 | |||
| 2024 | 922 | 128 | ||||||||||
| - = No Data Reported; -- = Not Applicable; NA = Not Available; W = Withheld to avoid disclosure of individual company data. |
| Release Date: 8/30/2024 |
| Next Release Date: 9/30/2024 |