|
Download Data (XLS File) |
|
||||||||
|
||||||||
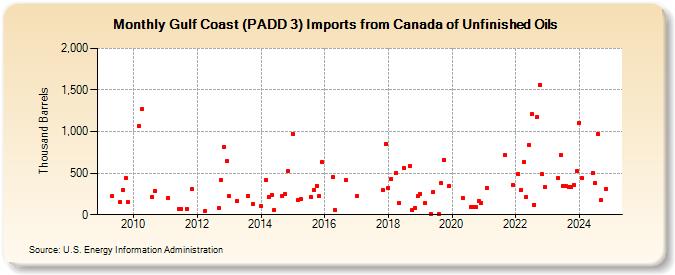
| Gulf Coast (PADD 3) Imports from Canada of Unfinished Oils (Thousand Barrels) | ||||||||
| Year | Jan | Feb | Mar | Apr | May | Jun | Jul | Aug | Sep | Oct | Nov | Dec |
|---|---|---|---|---|---|---|---|---|---|---|---|---|
| 2009 | 220 | 150 | 300 | 440 | 149 | |||||||
| 2010 | 1,062 | 1,271 | 210 | 286 | ||||||||
| 2011 | 203 | 64 | 66 | 69 | 304 | |||||||
| 2012 | 46 | 79 | 421 | 817 | 642 | |||||||
| 2013 | 224 | 165 | 229 | 130 | ||||||||
| 2014 | 100 | 420 | 214 | 243 | 54 | 230 | 251 | 521 | ||||
| 2015 | 973 | 181 | 191 | 207 | 293 | 351 | 227 | 630 | ||||
| 2016 | 453 | 54 | 414 | |||||||||
| 2017 | 220 | 300 | 855 | |||||||||
| 2018 | 323 | 430 | 505 | 146 | 559 | 588 | 57 | 80 | 222 | |||
| 2019 | 251 | 138 | 10 | 275 | 5 | 381 | 663 | 350 | ||||
| 2020 | 206 | 90 | 95 | 90 | 167 | 145 | ||||||
| 2021 | 326 | 713 | 362 | |||||||||
| 2022 | 487 | 300 | 638 | 210 | 844 | 1,211 | 121 | 1,170 | 1,565 | 487 | 331 | |
| 2023 | 442 | 717 | 340 | 340 | 330 | 336 | 360 | 524 | ||||
| 2024 | 1,108 | |||||||||||
| - = No Data Reported; -- = Not Applicable; NA = Not Available; W = Withheld to avoid disclosure of individual company data. |
| Release Date: 3/29/2024 |
| Next Release Date: 4/30/2024 |